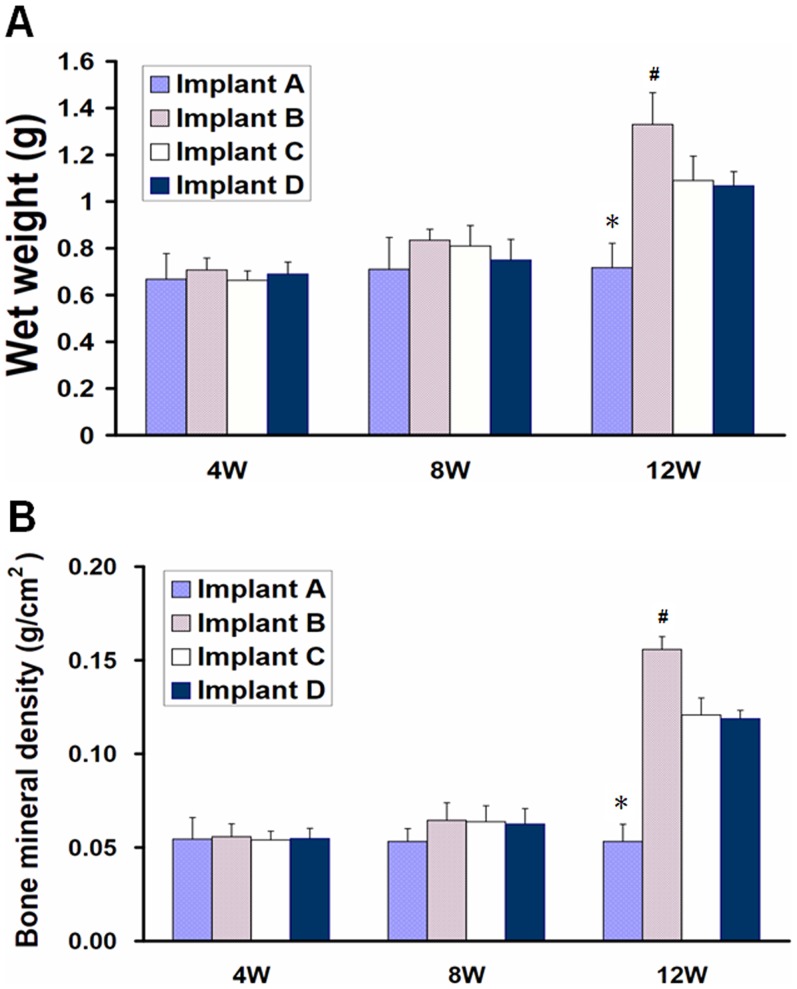
Figure 7. Wet weight and bone mineral density of implants after subcutaneous implantation in nude mice.
At 12 weeks postoperative, implant in group II showed higher wet weight (A) and bone mineral density (B) than that in other groups(p<0.05). *indicates a statistically significantly lower value compared with other implants; # indicates a statistically higher value compared with other implants.

