Figure 1.
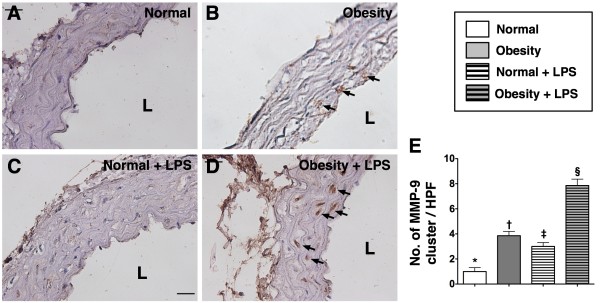
Immunohistochemical (IHC) staining (400x) for the cluster formation (≥ 2.0 μm) of matrix metalloproteinase (MMP)-9 in medial layer of aorta (n = 6). E) Showing the cluster formation of MMP-9 (black arrows) was significantly higher in obesity (B) than in normal control (A) prior to lipopolysaccharide (LPS) treatment, more significantly higher in obesity (D) than in normal control (C) after LPS treatment. Statistical analysis by one-way ANOVA. * vs. † vs. ‡ vs. §, p < 0.0001. Symbols (*, †, ‡, §) indicate significant difference (at 0.05 level) followed by Bonferroni’s multiple-comparisons post hoc test. L = lumen side. Scale bars in upper or lower corner represent 20 μm. HPF = high-power field.

