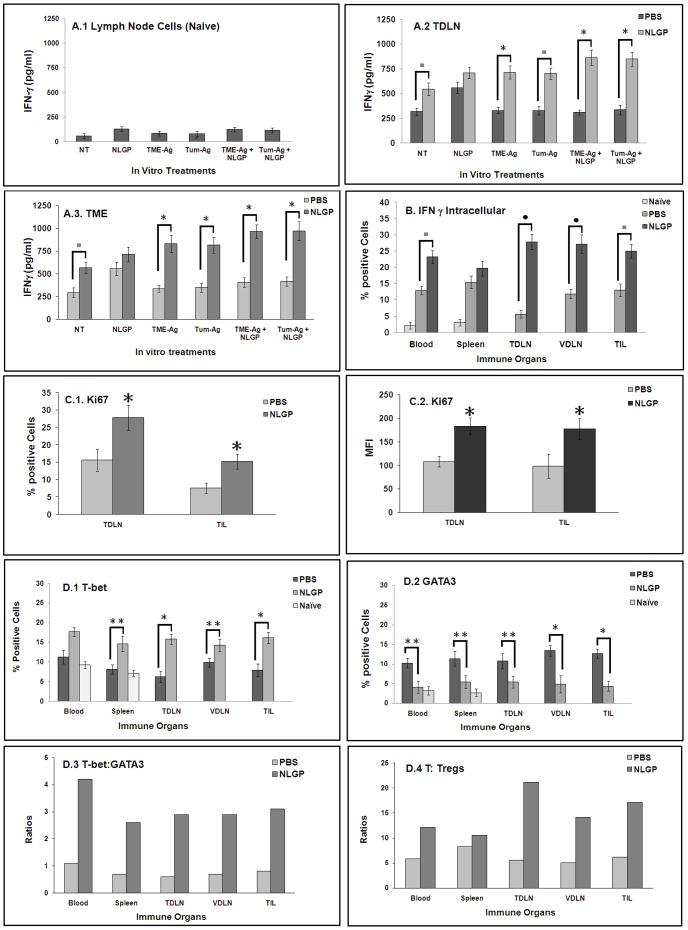
Figure 3. IFNγ secretion from immune cells of NLGP-treated tumor bearing mice.
Mice were inoculated with Sarcoma 180 cells (1×10⁶ cells/mice) and after the formation of palpable tumor mice of experimental group were treated (s.c.) with NLGP once a week. Mice were sacrificed on day 21 to collect TDLN and tumor and MNCs were purified. A. Cells from lymph nodes of naïve mice (A.1), TDLNs (A.2) and tumors (A.3) were cultured in vitro for 48 h in presence of NLGP, TME-Ag, Tum-Ag, TME-Ag+NLGP, Tum-Ag+NLGP in RPMI 1640. Culture supernatants were assessed for IFNγ release by ELISA. *p<0.01; ▪ p<0.05. B. Intra-cellular IFNγ expression of CD8+ T-cells in different immune compartments (from either PBS- or NLGP-treated group and from blood and spleen cells of naïve mice) was analyzed by flow cytometry. • p<0.01; ▪ p<0.05. C. MNCs isolated from TDLN and TIL of PBS- and NLGP-treated mice were labeled to detect the proliferation specific marker, Ki67, along with CD8+ cells. Percentage of proliferated cells within CD8 gated population and their MFI were presented. *p<0.01. D. Mice were inoculated with Sarcoma 180 cells (1×10⁶ cells/mice) and after formation of palpable tumor, mice of experimental group were treated with NLGP once a week. Mice were sacrificed on day 21 to collect blood, spleen, TDLN, VDLN and tumor and CD8+ T cells were purified from MNCs. Blood and spleen cells were also harvested from naive mice. Purified CD8+ T cells were intracellularly stained with anti-T-bet (D.1) and anti-GATA3 (D.2) antibodies to analyze through flow cytometry. Percent of T-bet and GATA3 positive cells from different immune organs is presented. *p<0.001; **p<0.01. Ratio between T-bet vs GATA3 (D.3) and T cells vs Tregs (D.4) is shown.

