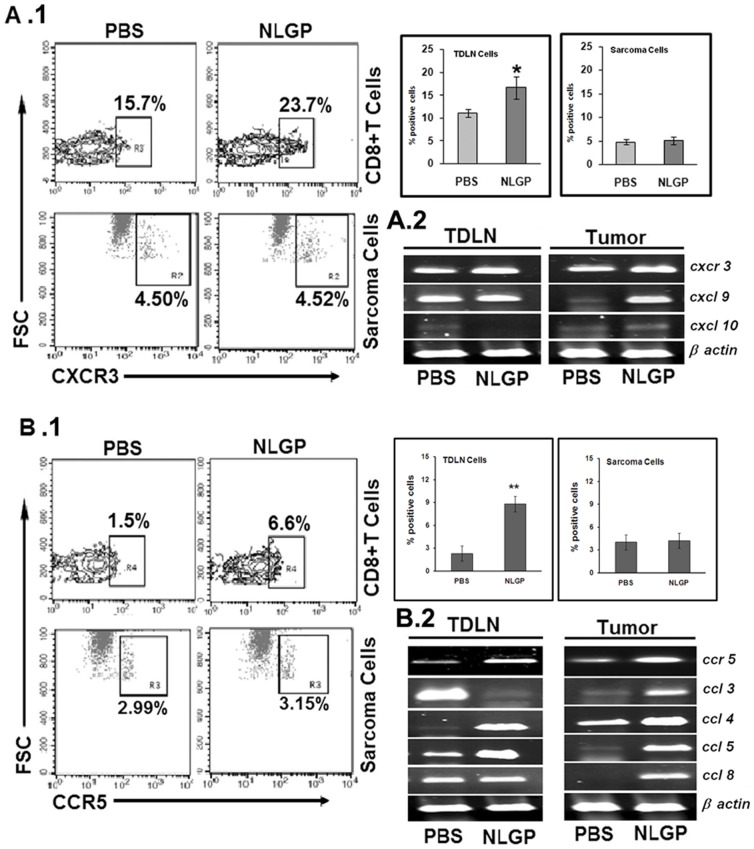
Figure 4. CXCR3, CCR5 expression on CD8+ T cells (from TDLN) and sarcoma cells.
Mice were inoculated with Sarcoma 180 cells (1×10⁶ cells/mice) and after formation of palpable tumor mice of experimental group were treated with NLGP (25 µg) once a week s.c. for 4 weeks in total. Mice were sacrificed on day 21 to collect TDLN and MNCs were purified. CD8+ T cells (upper panel, low FSC) and sarcoma cells (lower panel, high FSC) with or without NLGP treatment were stained with anti-CXCR3 (A.1) and anti-CCR5 (B.1) antibodies. Representative dot plots in each case (left panel) and bar diagrams (right panel) showing mean±SD values of six individual observations are presented. *p<0.01; **p<0.05. Total RNA was isolated from T cells of TDLN and tumor of the same PBS- and NLGP-treated mice and cxcr3 and its ligands, e.g., cxcl9, cxcl10 were analyzed at transcriptional level (A.2). Similarly, mRNA for ccr5 and corresponding ligands, e.g., ccl3, ccl4, ccl5 and ccl8, were also assessed (B.2).

