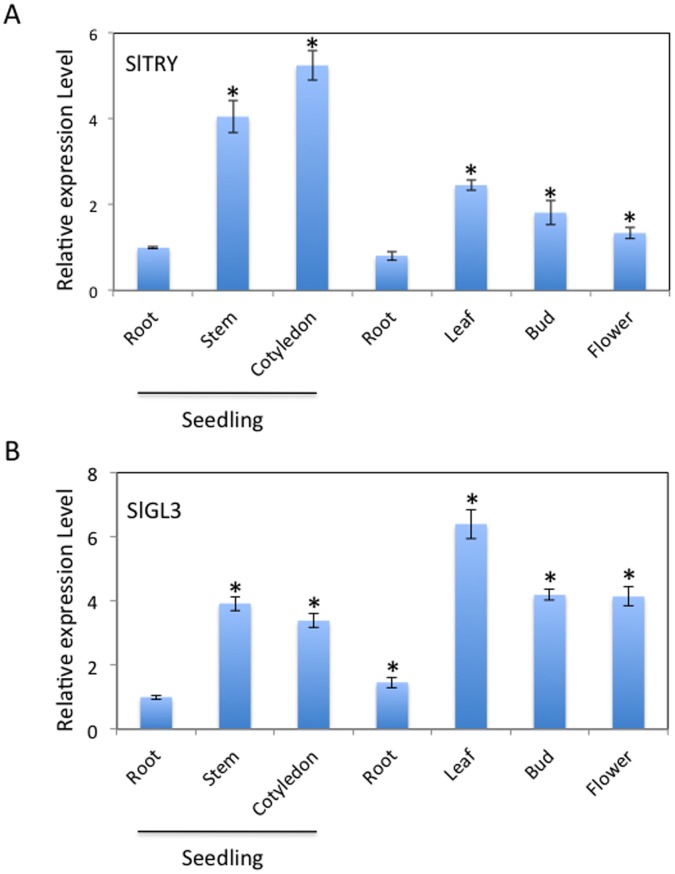
Figure 3. Tomato SlTRY and SlGL3 gene expression.
(A) Real-time reverse transcription PCR analysis of SlTRY gene expression in tomato organs. (B) Real-time reverse transcription PCR analysis of SlGL3 gene expression in tomato organs. Total RNA was isolated from the indicated tissues from 7-day-old seedlings and 5-week-old plants. Expression levels of SlTRY and SlGL3 in each organ relative to those in the seedling root were shown. The experiments were repeated three times. Error bars indicate the standard error. Bars marked with asterisks indicate a significant difference between the seedling root and the other organs by Student’s t-test (P<0.050).

