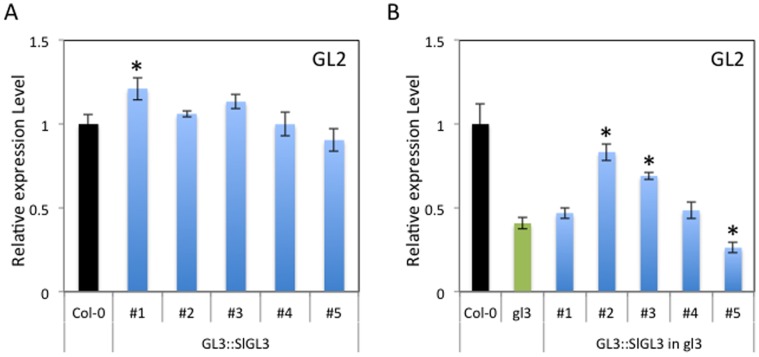
Figure 7. GL2 expression in CPC::SlGL3 transgenic plants.
Real-time reverse transcription PCR analyses of the GL2 gene in wild-type Col-0 and CPC::SlGL3 (#1, #2, #3, #4 and #5) (A), and wild-type Col-0, gl3-7454 mutant and CPC::SlGL3 in gl3-7454 (#1, #2, #3, #4 and #5) (B). Expression levels were normalized to Act2 expression. An expression level of GL2 in each line relative to that in wild-type was indicated. The experiments were repeated three times. Error bars indicate the standard error. Bars marked with asterisks indicate a significant difference between the wild-type Col-0 and the transgenic lines (A), or the gl3-7454 mutant and the transgenic lines (B) by Student’s t-test (P<0.050).

