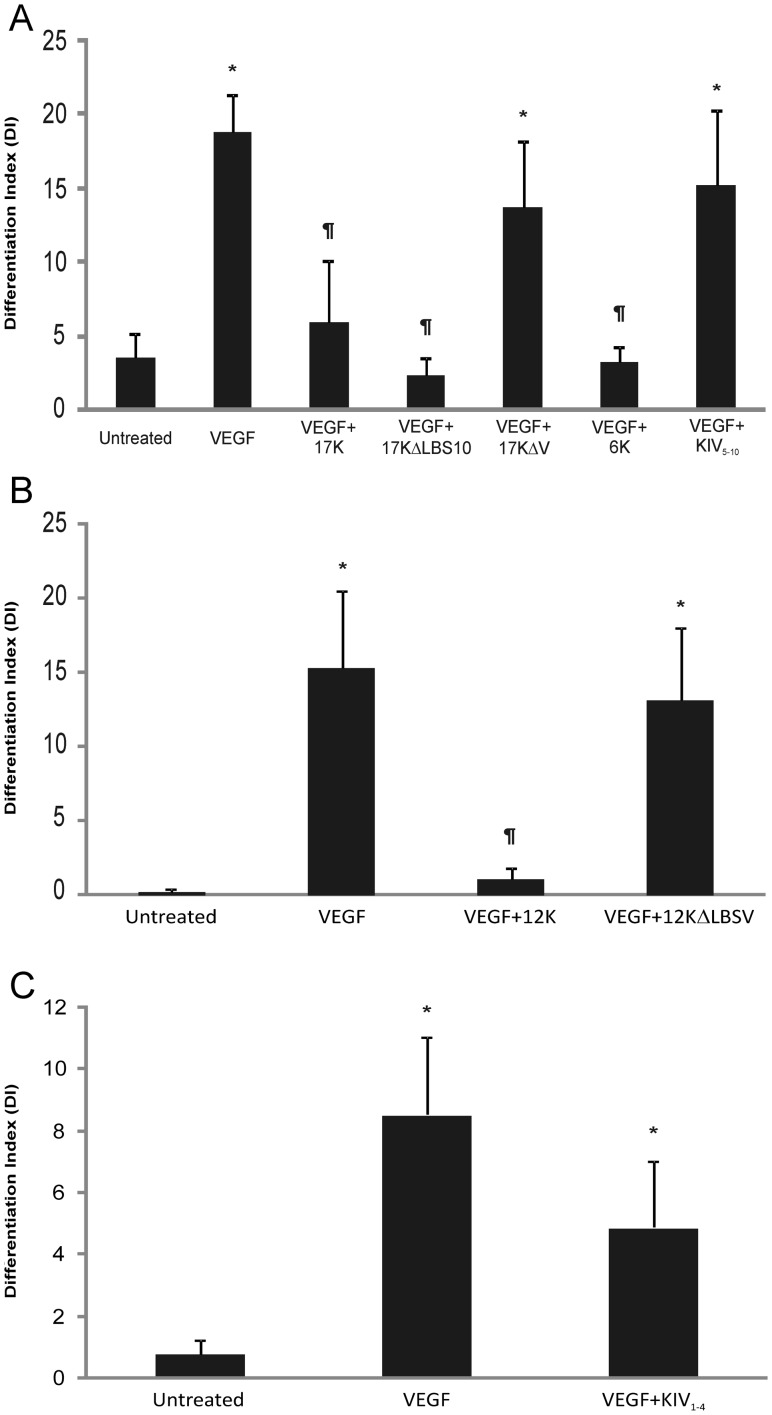
Figure 5. Effects of different r-apo(a) variants on HUVEC tube formation.
HUVECs were cultured on fibrin matrices with the indicated treatments (VEGF: 20 ng/mL; 17K r-apo(a) and all other variants: 100 nM). Tube formation was measured as described in the legend to Figure 2. Scale bars represent the mean ± standard deviation of the DI value obtained for each culture well from six independent images; data shown are representative of three independent experiments. Asterisks: p<0.01 versus untreated; daggers: p<0.01 versus VEGF.

