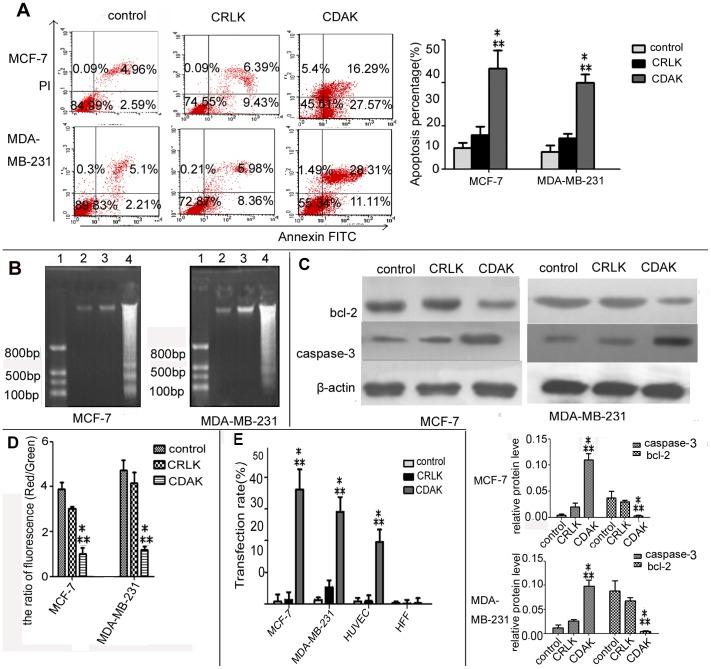
Figure 2. Characterization of the breast cancer cell death mechanism by CDAK.
(A) The apoptosis of breast cancer cells treated with CRLK (200 µg/ml) and CDAK (190 µg/ml in MCF-7, 212 µg/ml in MDA-MB-231) for 24 h were analyzed using flow cytometry for Annexin V/PI stain. The sum of the upper right and lower right quadrants are expressed as a percentage of the apoptotic cell. CDAK enhanced the percentage ratio of apoptosis, P<0.01. (B) Electrophoretic analysis of DNA extracted from MCF-7 and MDA-MB-231 treated with CRLK(200 µg/ml) and CDAK(190 µg/ml,212 µg/ml) for 24 h. Lane 1, DNA mark; Lane 2–4, control, CRLK and CDAK. The CDAK group forms a clear DNA ladder. (C) Pro-apoptosis protein caspase-3 and inhibit protein bcl-2 were analyzed by Western-blot. The whole protein of MCF-7 and MDA-MB-231 treated with CRLK (200 µg/ml) and CDAK (190 µg/ml,212 µg/ml) for 24 h were extracted. The expression levels were analyzed by the ratio of optical density with β-actin. CDAK inhibited the expression of bcl-2 promoted caspase-3 compared with CRLK and control, P<0.01. (D) MCF-7 and MDA-MB-231 treated with CRLK (200 µg/ml) and CDAK (190 µg/ml and 212 µg/ml) for 24 h were analyzed for the mitochondrial transmembrane potential using flow cytometry and JC-1. The ratio of fluorescence (red/green) indicates the mitochondrial transmembrane potential. CDAK decreased the ration of fluorescence, P<0.01. (E) The affinity rate of CRLK and CDAK (10 µg/ml) for 12 h were analyzed using flow cytometry. MCF-7 and MDA-MB-231 showed more binding than HUVEC and HFF, especially MCF-7, P<0.01 (ANOVA assay). The results are represented as means± SD from triplicate determinations. * P<0.05 versus control; ** P<0.05 versus CRLK.

