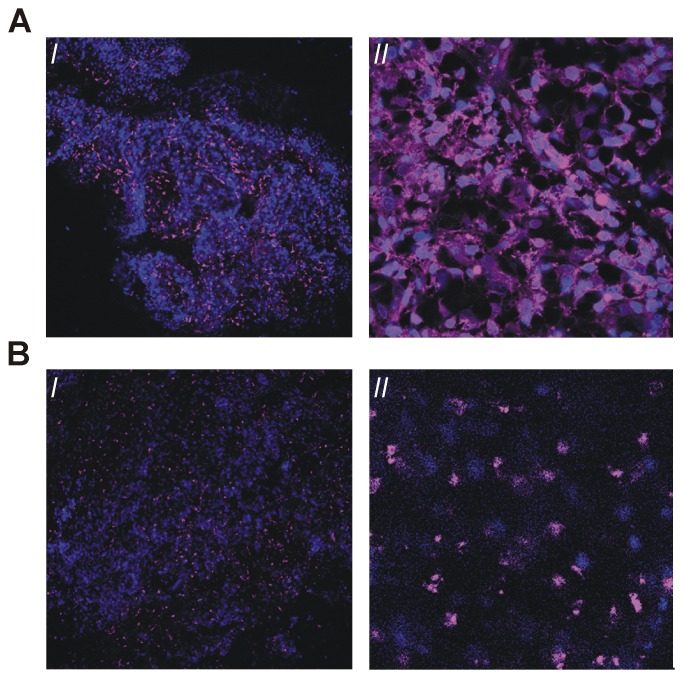
Figure 5. Evaluation of freshly isolated MIN-O tumor slices.
A) ex vivo incubation with MSAP-Ac-TZ14011 and B) after intravenous injection of MSAP-Ac-TZ14011 twenty-four hours prior to evaluation of the tissue. I: 10× magnification. II) 63× magnification. Signal emitted by MSAP-Ac-TZ14011 is depicted in magenta and DAPI (blue) was used to visualize the cell nucleus.

