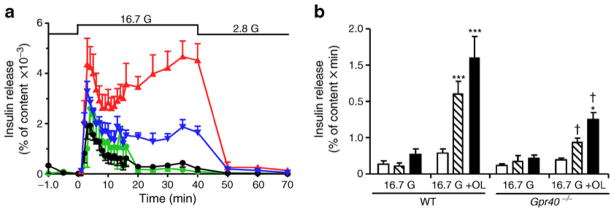
Fig. 1.
Oleate potentiates the second phase of GSIS largely via GPR40. (a) Insulin secretion in response to 2.8 mmol/l glucose from −10 to 0 min (all groups), 16.7 mmol/l glucose (black and green lines) or 16.7 mmol/l glucose +0.5 mmol/l oleate (blue and red lines) from 0 to 40 min, and 2.8 mmol/l glucose from 40 to 70 min (all groups) in WT (black and red) or Gpr40−/− islets (green and blue lines) in perifusion experiments. (b) Calculation of the AUC from 0 to 10 min (white bars), from 10 to 40 min (hatched bars), and from 0 to 40 min (black bars). Results are mean±SEM of four independent experiments. G, glucose; OL, oleate. *p<0.05, **p<0.01 and ***p<0.001 compared with the 16.7 mmol/l (16.7 G) condition for each genotype; †p<0.001 compared with the respective condition in WT

