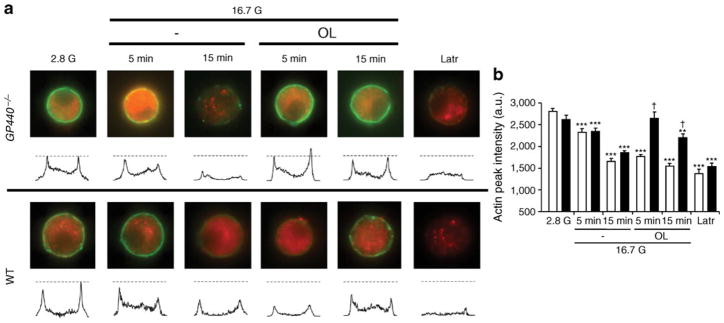
Fig. 2.
Oleate induces cortical F-actin depolymerisation. (a) Representative images for F-actin staining (green) for each incubation condition with intensity line scans for F-actin staining intensity. Dashed lines represent the F-actin intensity means for the 2.8 mmol/l glucose (2.8 G) condition. Beta cells were identified by insulin staining (red). (b) Mean ±SEM of F-actin intensities from 40–62 cells from three WT (white bars) or Gpr40−/− (black bars) mice. a.u., arbitrary units; G, glucose; Latr, latrunculin; OL, oleate. *p<0.05, **p<0.01 and ***p<0.001 compared with the 2.8 G condition for each genotype, †p<0.001 compared with the respective condition in WT

