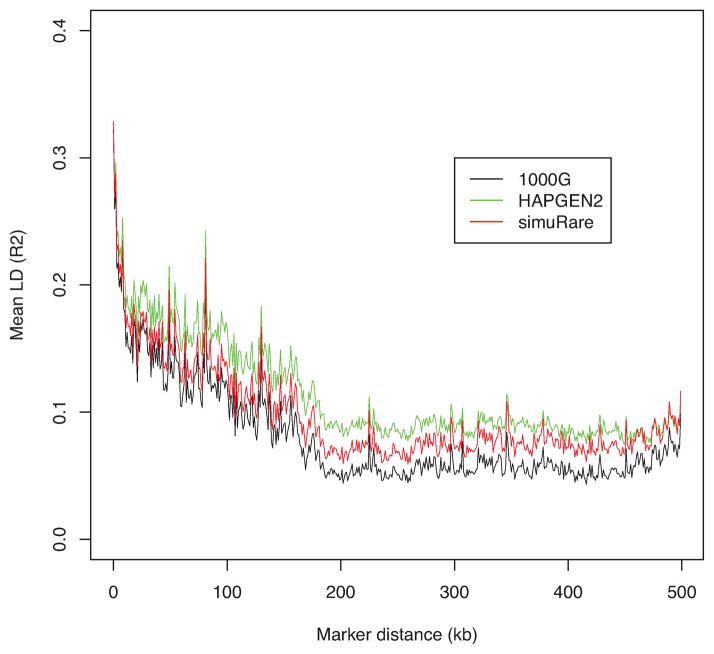
Figure 5. LD patterns by different simulation methods and their reference (1000 Genomes without rare SNPs).
Each curve demonstrates the change of the averaged value over pairwise LD (R2) values along different marker distances for HAPGEN2 and regression-based algorithm, and their reference 1000 Genomes Phase I interim sample after removing SNPs with MAF less than 0.01 (black).

