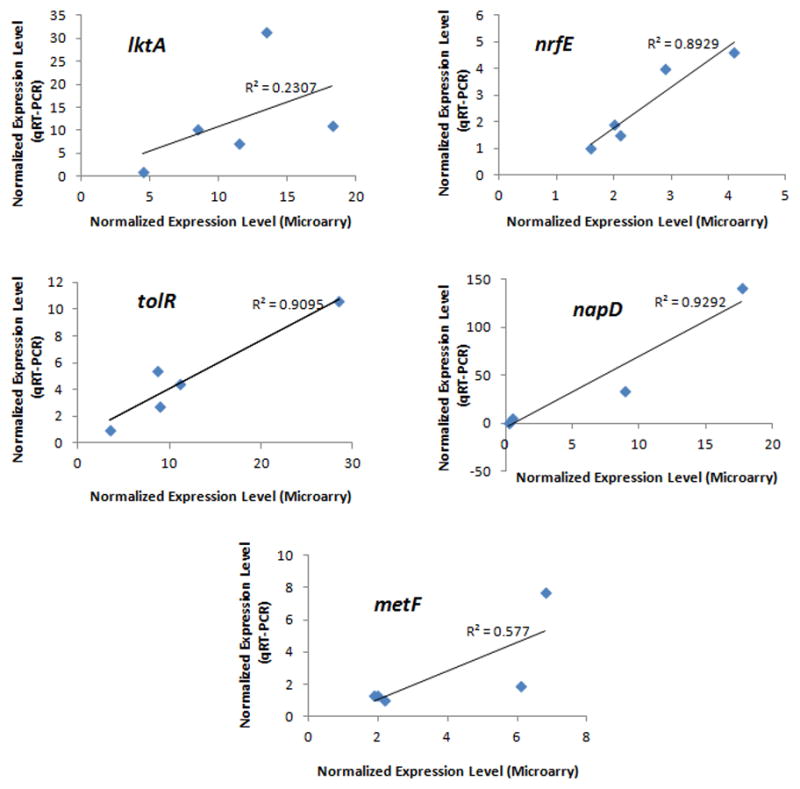
Figure 5. Correlation of the gene expression levels determined by qRT-PCR and by hybridization with microarray.

Identical samples (3 strains of JP2 genotype and 2 strains of non-JP2 genotype) were used in both quantification methods to determine the expression levels of the 5 selected genes: lktA, tolR, nrfE, napD and metF. The expression level of the housekeeping gene clpX was used to normalize the levels of the target genes in each sample. For qRT-PCR, the sample with the lowest transcript level was arbitrarily set as 1. Linear trend and R2 value are provided for each graph. Excellent correlations were found for tolR, nrfE, napD. For lktA and metF, the trend in the expression levels was consistent between the two quantification methods.
