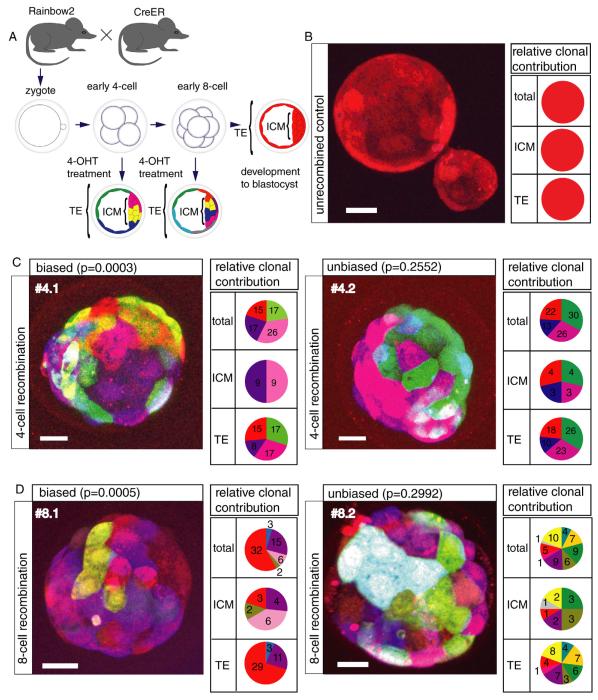
Figure 3. Skewed contribution of cleavage stage blastomeres to TE and ICM lineages.
(A) Experimental outline: Embryos were treated with 4-OHT at different stages of development, and contribution of each recombined clone to the ICM and TE was quantified. Images are confocal projections of whole-mount embryos (B) An untreated Rainbow2; CreER blastocyst, where only dTomato expression can be detected. The structure in the lower right corner is cells hatching from the ZP. (C-D) Representative Rainbow2; CreER embryos treated with 4-OHT at the 4-cell (C) and 8-cell (D) stages. Embryos are labeled as biased or unbiased. Scale bars 20 μm. P = Fisher probability value for each embryo. Pie charts represent proportional contribution of cells in each clone to the overall embryo, ICM, or TE. The number of cells in each population is listed on the corresponding slice of the pie chart. See also Figure S3 and Tables S1-S4.

