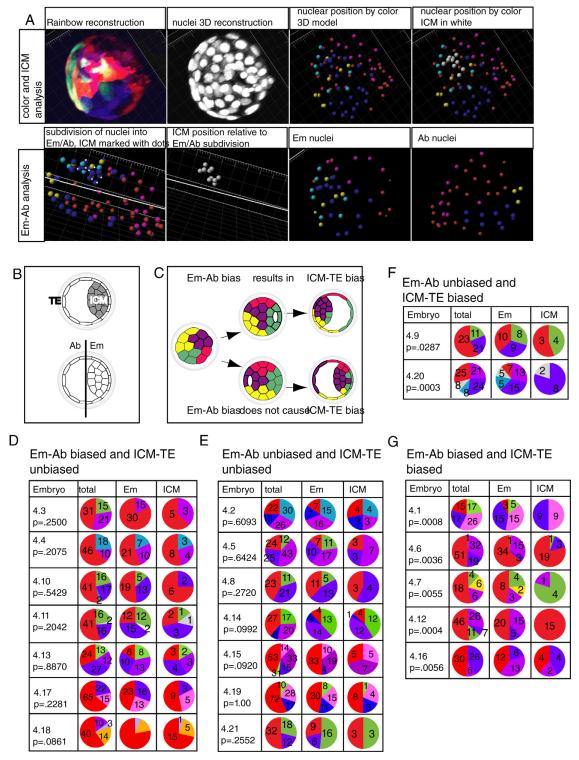
Figure 5. Comparison between embryonic-abembryonic contribution and TE-ICM bias.
(a) Analysis of contribution of clones to embryonic and abembryonic regions of a representative Rainbow embryo, showing colors, nuclei, designation of differently colored spots, designation of the ICM and the embryonic-abembryonic axis, and contribution of different clones to the embryonic and abembryonic halves of the embryo. (b) an illustration of the difference between TE/ICM and Em-AB designations (c) Model: Biased contribution of blastomeres to the ICM could be uncoupled from hemisphere bias if the blastocoel cavity forms independently of the location of a clone that preferentially contributes to the ICM. The number of cells in each population is listed on the corresponding slice of the pie chart. (d-g) A comparison of ICM versus embryonic contribution in embryos that had been treated with 4-OHT at the 4-cell stage. “Emb” indicates proportion of contribution to the embryonic hemisphere of the blastocyst. See also Figure S5.

