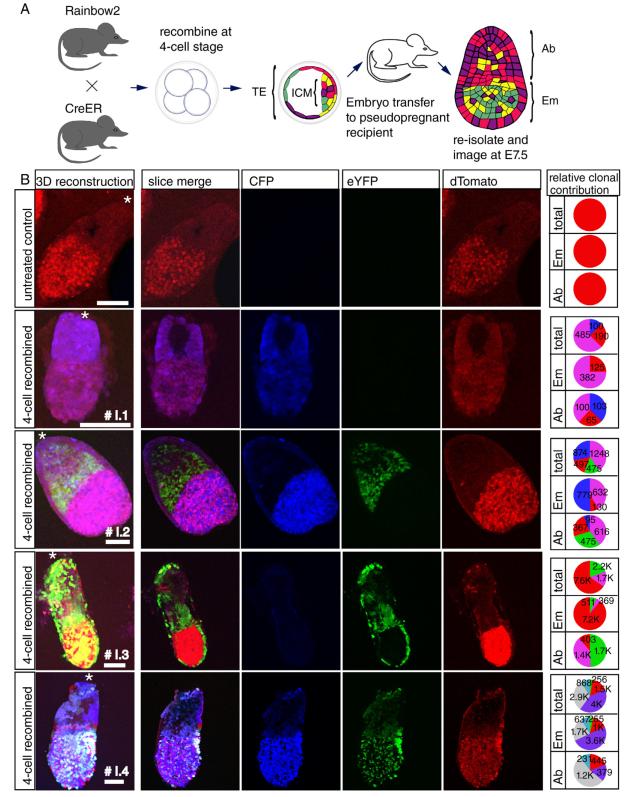
Figure 6. Preferential contribution of clones resulting from 4-OHT treatment at the 4-cell stage to different regions of postimplantation embryos.
(a) Experimental outline: Embryos were induced to undergo recombination at the 4-cell stage, transferred into pseudopregnant recipients, and re-isolated at E7.5 for analysis. (b) Slices and 3D reconstructions of resulting embryos show skewed contribution of clones to either embryonic or abembryonic lineages. Asterisks indicate location of ectoplacental cone. Scale bars=100 μm. The number of cells in each population is listed on the corresponding slice of the pie chart. See also Figure S6.

