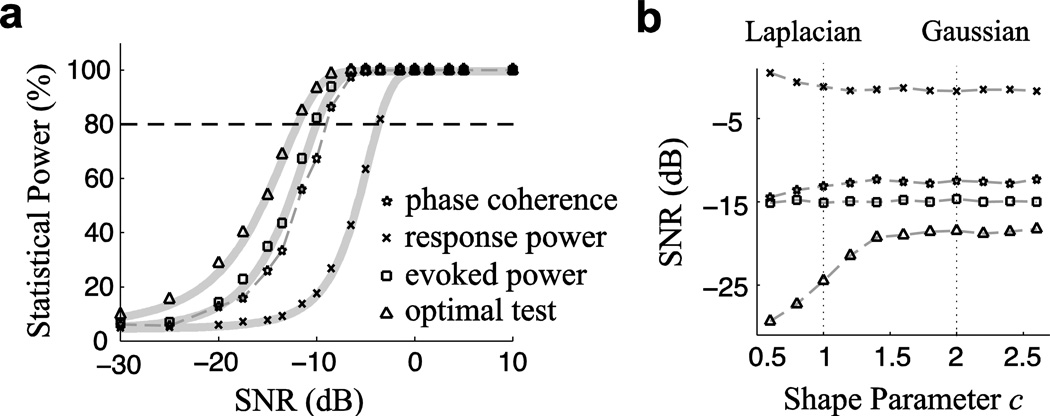
Figure 2.
(a) The statistical power of four significance tests as a function of SNR when background activity is subject to the Gaussian distribution. Each point in the figure is a Monte Carlo numerical result; the theoretical statistical power, when available, is plotted as a solid gray line. Test statistics whose curves lie more to the left possess greater statistical power at the same SNR than those to the right. Similarly, to achieve 80% statistical power, each test requires a different minimum SNR, where smaller SNR values demonstrate greater overall statistical power. (b) The SNR required for 80% statistical power, for background activity subject to the generalized Gaussian distribution (smaller SNR values demonstrate a more effective significance test). Phase coherence is much more effective than response power when testing the significance of a neural response.

