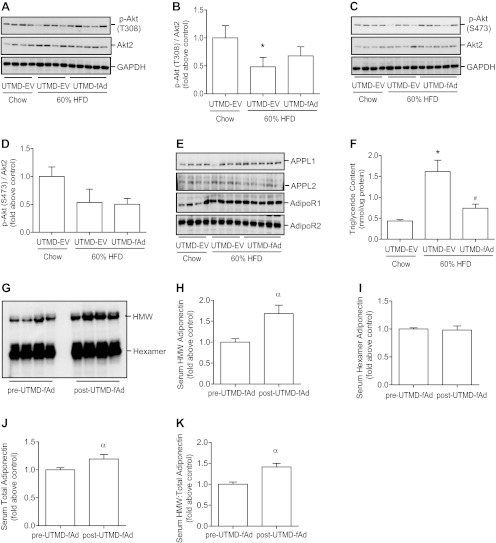
Fig. 5.
Serum adiponectin, insulin, and adiponectin signaling, lipid analysis in liver. Mice were fed either commercial chow or 60% HF diet at the age of 6 wk. After 12 wk HF diet, we used UTMD to deliver either pGL3 (EV) or fAd plasmid to hind leg skeletal muscles. Serum samples were collected pre- and post-UTMD procedure. Seven days post-UTMD, animals were starved 5–6 h, and insulin was administered as a bolus injection (4 U/kg body wt) via tail vein. Fifteen minutes after injection, liver tissue was collected, and homogenates were prepared and then analyzed by Western blotting. Representative Western blot of p-Akt [T308 (A), S473 (C), total Akt2 (A and C)] and quantitative analysis [T308 (B), S473 (D)]. E: representative Western blot for AdipoR1, AdipoR2, APPL1, and APPL2. F: liver triglyceride content (nmol/μg protein). G-K: representative Western blot and quantitative analysis of serum adiponectin level. Data represent means ± SE. *P < 0.05, chow-fed UTMD-EV vs. 60% HFD UTMD-EV, #P < 0.05, 60% HFD UTMD-EV vs. 60% HFD UTMD-fAd, and αP < 0.05 vs. pre-UTMD; n = 4–5.

