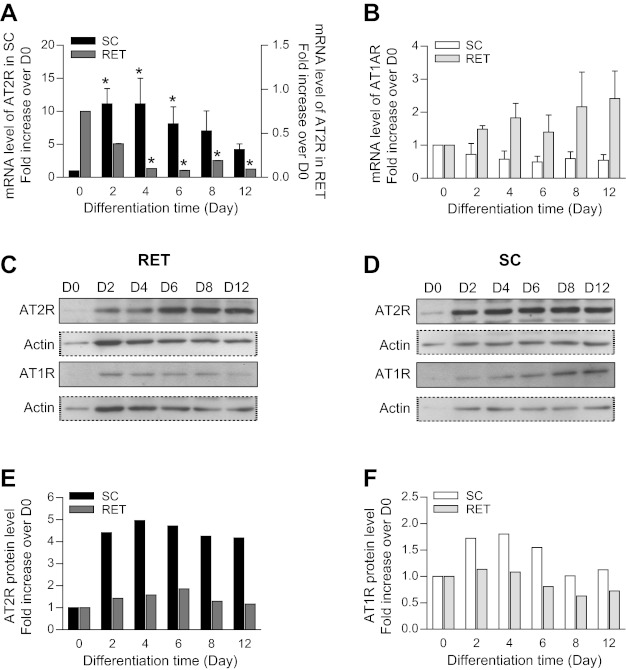
Fig. 2.
ANG II receptor 1A (AT1AR) and AT2R mRNA (A and B) and protein expression (C–F) throughout preadipocyte differentiation. Preadipocytes from RET and SC adipose tissues were plated in 35-mm Petri dishes at a density of 1.5 × 10⁴/cm2. To initiate the process of differentiation, cells were cultured in DMEM-F12 medium-enriched differentiation cocktail as described in research design and methods. Densitometric analysis of mRNA levels of AT2R (A) and AT1AR (B) during differentiation of SC and RET preadipocytes. mRNA of target genes was normalized to that of β-actin (n = 3–4). Statistical analyses were performed using one-way ANOVA followed by Newman-Keuls post hoc test. Statistical significance vs. day 0 of differentiation: *P < 0.02. C–F: cell lysates containing equal concentrations of protein (20 μg) were processed for Western blotting using anti-AT2R antibody (1:500; C) and anti-AT1R antibody (1:500; D). Amount of loaded protein was compared by reprobing the membrane with an anti-β-actin antibody (1:8,000). E and F: corresponding densitometric analysis of Western blotting shown in C and D.

