Fig. 1.
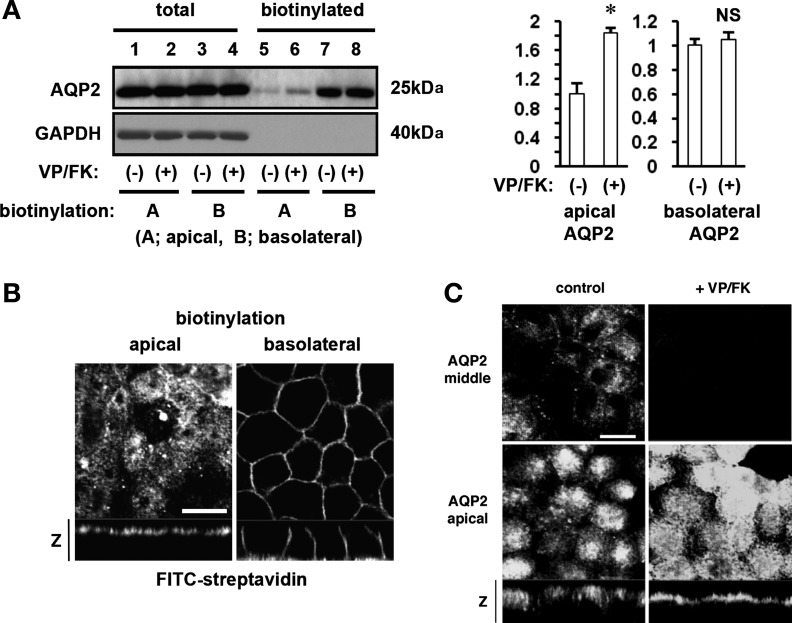
Subcellular distribution of aquaporin-2 (AQP2) in polarized MDCK cells. A: site-specific biotinylation was performed from the apical (lane 1, 2, 5, 6) or the basolateral (lane 3, 4, 7, 8) side with (lanes 2, 4, 6, 8) or without (lane 1, 3, 5, 7) vasopressin (VP)/forskolin (FK) treatment (VP 20 nM and FK 50 μM for 20 min). As quantified in the histograms to the right of the immunoblot, apical AQP2 was significantly increased after VP/FK treatment (lane 5 and 6, top, and left histogram). Basolateral AQP2 was strongly and equally detected with or without VP/FK treatment (lane 7 and 8, top, and right histogram). Total amounts of AQP2 were not different among these samples (lane 1–4, top). The same PVDF membrane was stripped, and reprobed with GAPDH antibody (bottom). GAPDH was well expressed in MDCK cells (lane 1–4, bottom) but was not detected either in apical or in basolateral membrane fractions (lane 5–8, bottom). *P < 0.05; NS, not significant. B: plasma membrane-bound biotin was visualized using FITC-streptavidin. AQP2-MDCK cells were biotinylated from the apical (left) or basolateral (right) side, and bound biotin was visualized by FITC-streptavidin. FITC-streptavidin was detected only at the side to which biotin was added. The larger panels represent confocal sections through the apical (left) or middle (right) regions of the cells. Bar, 10 μm. The smaller horizontal strips at the bottom are z-sections to show apical and basolateral membranes. C: AQP2-MDCK cells were treated with (right) or without (left) VP/FK (VP 20 nM and FK 50 μM for 20 min), and AQP2 was immunolocalized. The larger panels represent confocal sections through the middle (top) or apical (bottom) regions of the cells as indicated. The smaller horizontal strips at the bottom of the lower (apical) panels are z-sections to show both apical and basolateral regions of the cells. After VP/FK treatment, apical AQP2 was clearly increased and appears as a sharper apical band of staining in the z-section compared to the untreated control on the left. However, basolateral AQP2 accumulation was not detected either with or without VP/FK treatment. The images are representative of three independent experiments. Bar, 10 μm.

