
Fig. 2.
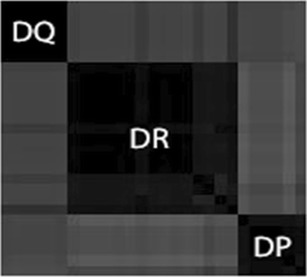
The true cluster plot of 27 HLA II proteins after performing p value-based multiscale bootstrap resampling hierarchical clustering. Three different clusters are clearly visible, corresponding to the three different loci DQ, DR, and DP
Official websites use .gov
A
.gov website belongs to an official
government organization in the United States.
Secure .gov websites use HTTPS
A lock (
) or https:// means you've safely
connected to the .gov website. Share sensitive
information only on official, secure websites.
The true cluster plot of 27 HLA II proteins after performing p value-based multiscale bootstrap resampling hierarchical clustering. Three different clusters are clearly visible, corresponding to the three different loci DQ, DR, and DP