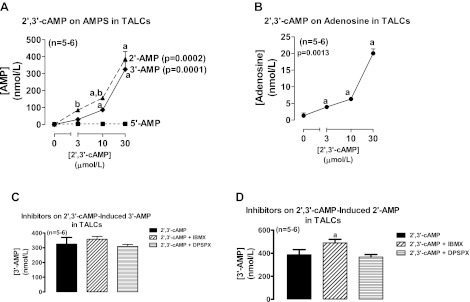
Fig. 2.
Line graphs illustrate the concentration-dependent effects of 2′,3′-cAMP on levels of 2′-AMP, 3′-AMP, and 5′-AMP (A) and adenosine (B) in the medium of cultures of rat thick ascending limb cells (TALCs). Bar graphs illustrate the effects of IBMX (1 mmol/l; broad spectrum phosphodiesterase inhibitor) and DPSPX (1 mmol/l; ecto-phosphodiesterase inhibitor) on the metabolism of 2′,3′-cAMP to 3′-AMP (C) and 2′-AMP (D) in TALCs. P values in panels are from Kruskal-Wallis 1-way ANOVA on ranks. aP < 0.05 compared with basal (0) and bP < 0.05 comparing 2′-AMP levels with 3′-AMP levels at the indicated treatment concentration of 2′,3′-cAMP (Kruskal-Wallis multiple-comparison Z-value test).

