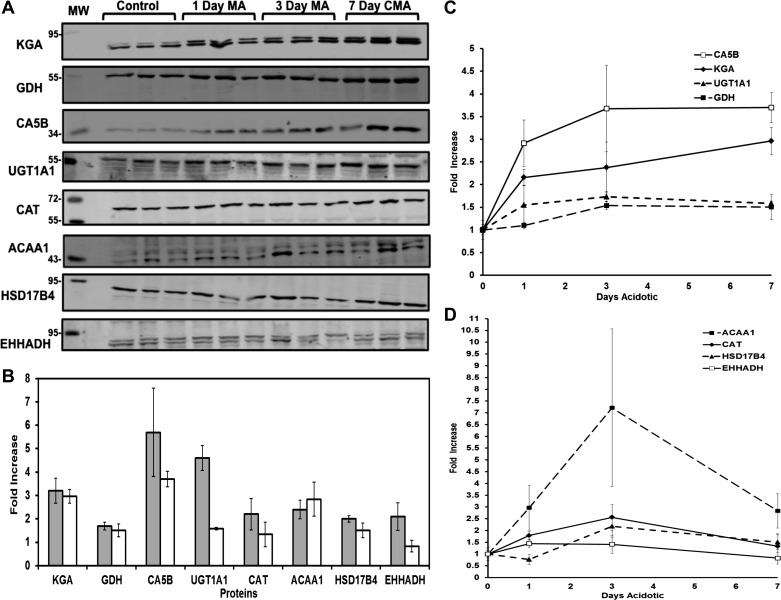
Fig. 5.
Western blot analysis of the temporal changes in abundance of proteins identified by spectral count analysis. A: separate mitochondrial samples were isolated from PCT of three control, three 1-day MA, three 3-day MA, and three 7-day CMA rats. Western blot analysis was performed using 8 specific antibodies to validate the changes in protein abundance calculated by comparing the spectral counts of control and 7-day CMA samples. MW are molecular weight standards. Each blot was normalized to a mitochondrial protein that served as a loading control. The bands were imaged and quantified with an Odyssey Infrared Imager. B: comparison of the fold-changes calculated from Western blot analyses (open bars) and spectral counts (filled bars). Values are means ± SE of the fold-increase in the triplicate 7-day acidotic samples normalized to the control samples. C and D: time course of the fold-changes in the 8 proteins during development of chronic acidosis derived from the Western blot analyses in A. Values are means ± SE of triplicate samples.

