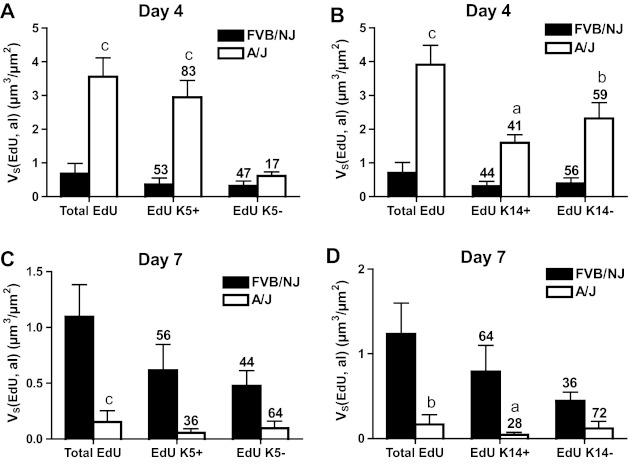
Fig. 13.
Morphometric analysis of EdU staining in K5- and K14-expressing cells in bronchial epithelium. The volume of EdU staining normalized to airway lumen surface area (VS) in the bronchial epithelium of the left lung and the inferior lobe of right lung was measured as described in materials and methods. Values are means ± SE (n = 5–8 mice per group). The numbers above the bars indicate the percentage of total EdU staining that was in K5+ and K5− cells (A and C) or in K14+ and K14- cells (B and D). aP < 0.05 vs. FVB/NJ; bP < 0.01 vs. FVB/NJ; cP < 0.001 vs. FVB/NJ.

