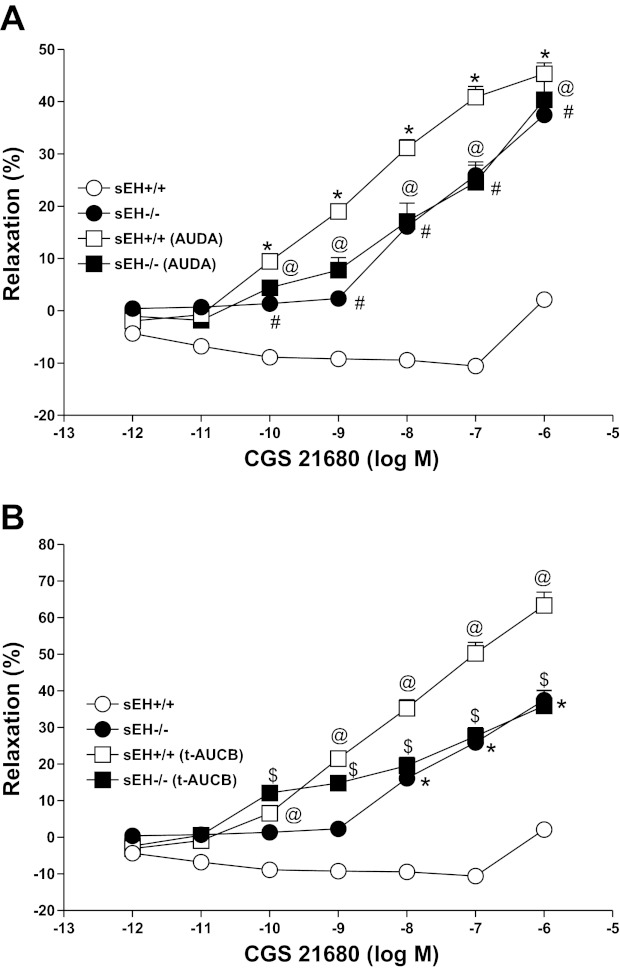
Fig. 7.
Effect of AUDA (10 μM) on CGS 21680 induced vascular response in aortic rings of sEH+/+ and sEH−/− mice (A). The control curve is the same as in Fig. 6. #P < 0.05, sEH+/+vs. sEH−/− mice. *P < 0.05, sEH+/+ vs. sEH+/+ mice treated with AUDA. @P < 0.05, sEH+/+ vs. sEH−/− treated with AUDA; n = 8 (A). Effect of t-AUCB (10 μM) on CGS 21680-induced vascular response in aortic rings of sEH+/+ and sEH−/− mice (B). The control curve is the same as in Fig. 6. *P < 0.05, sEH+/+ vs. sEH−/− mice. @P < 0.05, sEH+/+ vs. sEH+/+ mice treated with t-AUCB. $P < 0.05, sEH+/+ vs. sEH−/− mice treated with t-AUCB; n = 8 (B). Values are expressed as means ± SE.

