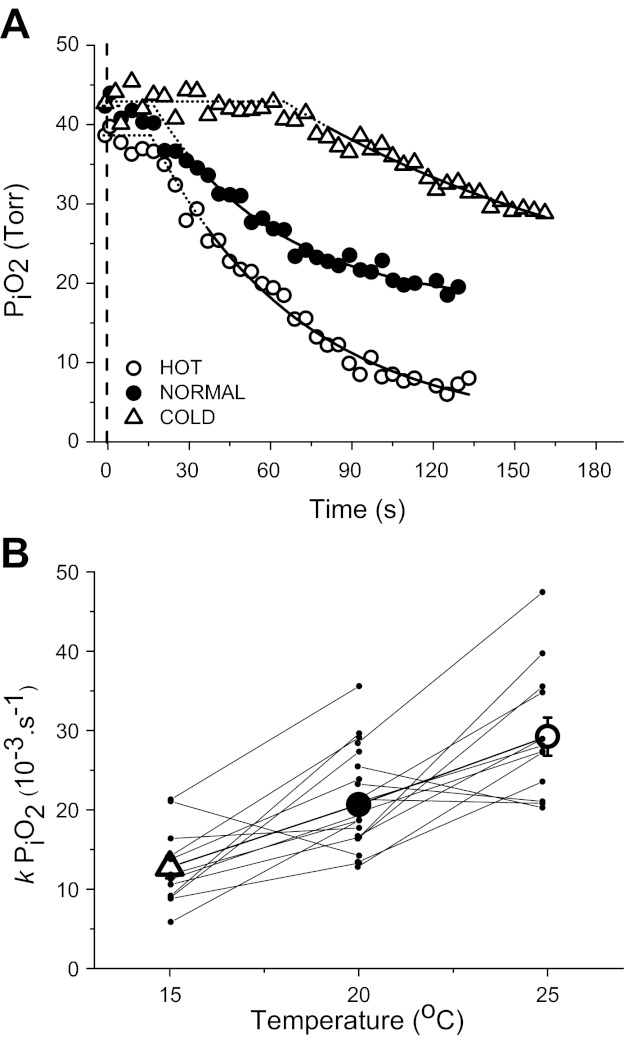
Fig. 1.
A: representative example of intracellular Po2 (PiO2) responses to stimulated contractions of single Xenopus skeletal muscle fibers at different muscle temperatures: cold (C, 15°C), normal (N, 20°C), and hot (H, 25°C). The fitted response is displayed as a solid line, while extrapolated fit is represented by the dotted line. The dashed vertical line shows the start of contractions. B: linear relationship between the rate constant (k = 1/τ) for PiO2 and muscle temperature for all data points (r = 0.322, P = 0.03).

