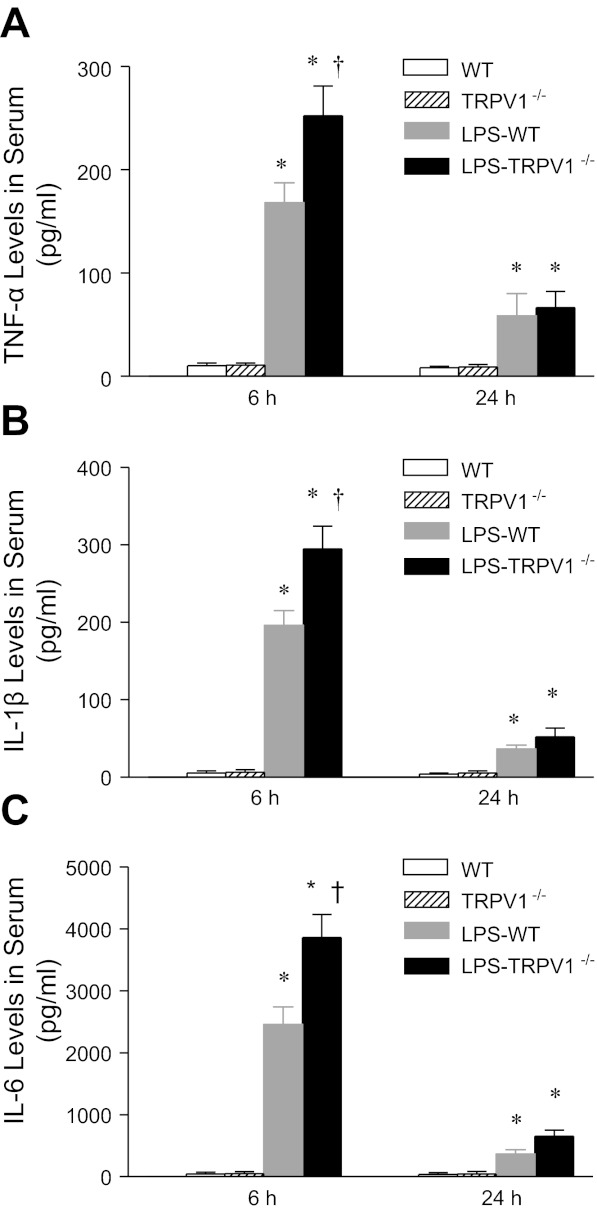
Fig. 3.
Time-course responses of serum tumor necrosis factor (TNF)-α (A), IL-1β (B), and IL-6 (C) to bolus injection of LPS (3 mg/kg ip) in WT and TRPV1−/− mice. Serum samples were collected at 6 or 24 h after LPS treatment. Values are means ± SE (n = 7–8). *P < 0.05 compared with control WT or TRPV1−/− mice. †P < 0.05 compared with LPS-treated WT mice.

