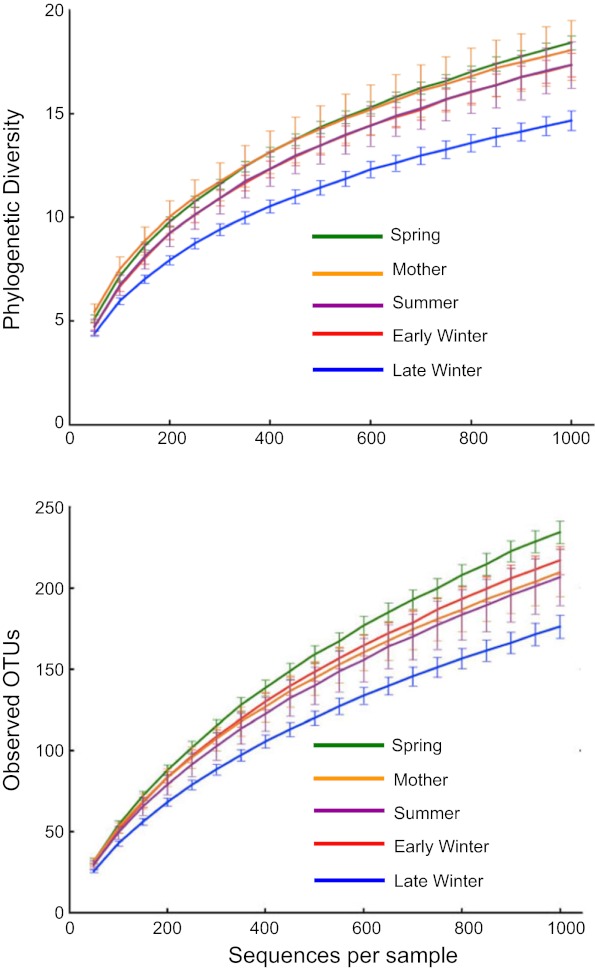
Fig. 2.
Alpha diversity rarefaction plots of squirrel cecal microbiotas. Top: phylogenetic diversity (PD). Bottom: number of observed OTUs based on 97% sequence identity. Points are means ± SE, with numbers of squirrels in each group shown in Table 1. Differences among groups were analyzed at 1,000 sequences/sample. For PD, all groups differed significantly from one another (P < 0.05) except for early winter and summer. For observed OTUs, all groups differed except for the mother and summer groups.

