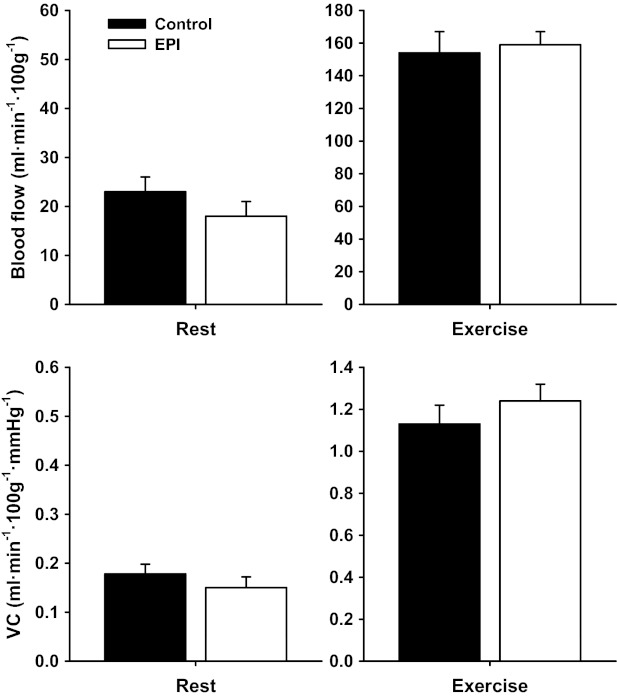
Fig. 2.
Total hindlimb muscle blood flow and vascular conductance (VC) at rest and during submaximal treadmill exercise for control and EPI rats. Within control and EPI groups, exercising blood flow and VC were significantly different (P < 0.05 for all) from rest. There were no differences between control and EPI groups. Note different y-axis scales for rest and exercise graphs. Data are means ± SE; control, n = 11; and EPI: n = 11.

