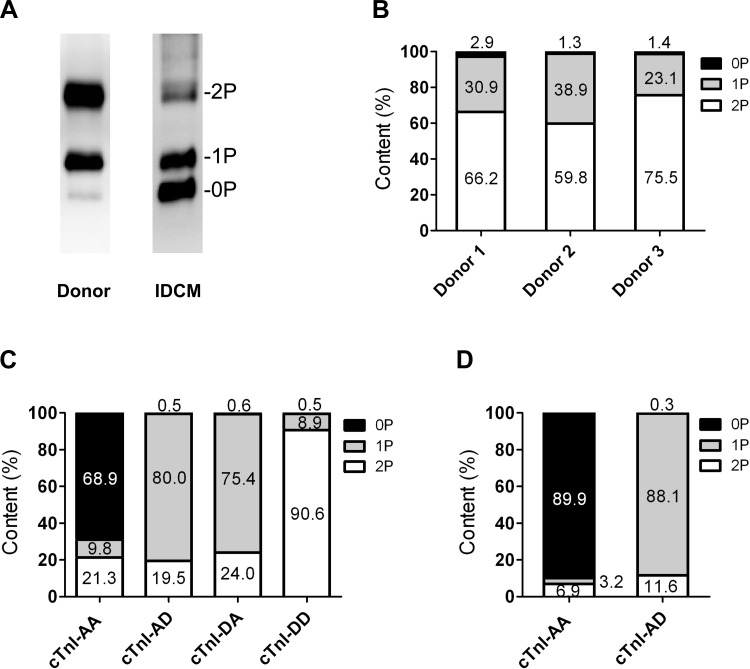
Fig. 2.
cTnI (pseudo-)phosphorylation levels after exchange. A: Phos tag-stained gel showing cTn phosphorylation at baseline (i.e., before exchange). B: distribution of phosphospecies of the three donor samples used in the exchange experiments. C (1 mg/ml) and D (2 mg/ml): percentages of unphosphorylated (0P; endogenous unphosphorylated cTnI plus recombinant cTnI-AA), monophosphorylated (1P; endogenous monophosphorylated cTnI plus recombinant cTnI-AD/DA), and bisphosphorylated (2P; endogenous bisphosphorylated cTnI plus recombinant cTnI-DD) cTnI species after exchange calculated with the cTn exchange percentages determined with immunoblot analyses (as shown in Fig. 1E). IDCM, ideopathic dilated cardiomyopathic sample.

