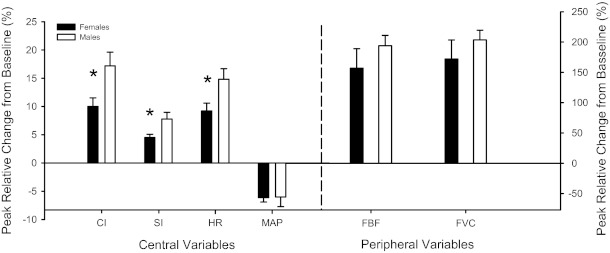
Fig. 2.
Individual peak relative changes in central and peripheral hemodynamic of women and men. MAP, mean arterial pressure; FBF, femoral blood flow; FVC, forearm vascular conductance. Note: these data represent individual peak responses, which are underrepresented in Figs. 1 and 3. Data are expressed as means ± SE. *P < 0.05, men vs. women.

