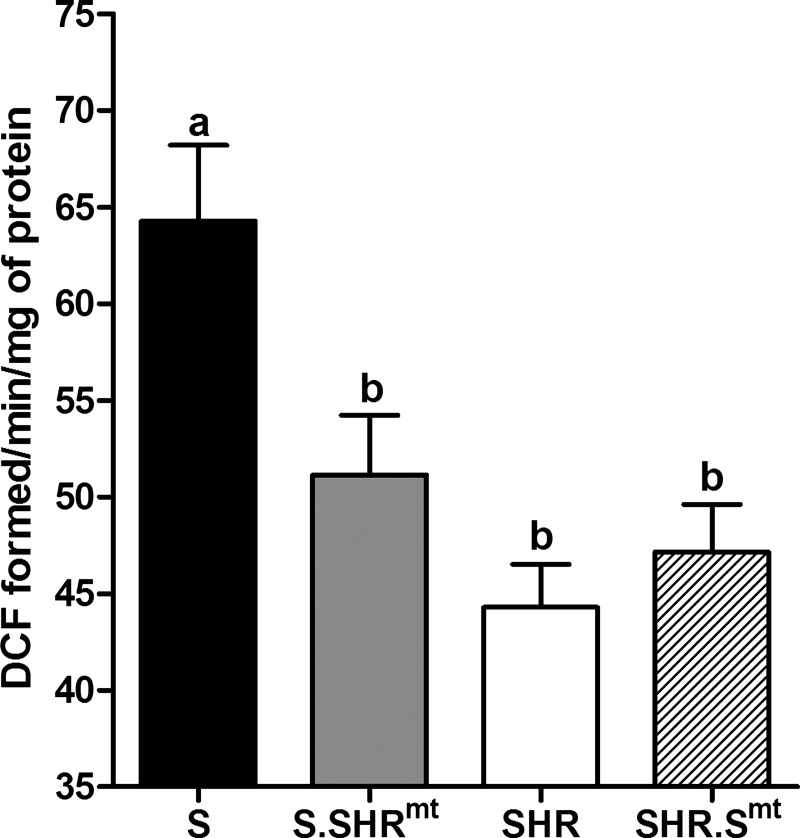
Fig. 4.
Assessment of mitochondrial oxidant generation. Values are expressed as dichlorofluorescein (DCF) fluorescence per minute per milligram of mitochondrial protein. Values are means ± SE; n = 4/group. Bars labeled with the same letters were not significantly different from each other. Bars labeled with different letters were significantly different from each other, P < 0.05.

