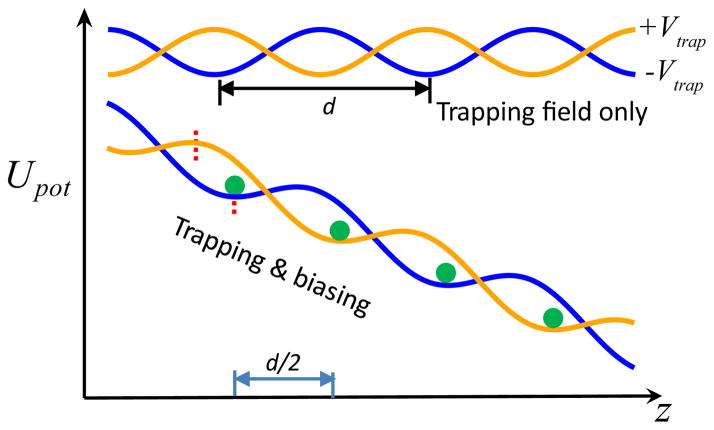
Fig. 9.
Electric potential energies for ssDNA in the DNA transistor with (lower two lines) and without (upper two lines) a biasing electric field. The voltage on the middle electrode (Fig. 7a) alternates between positive (orange) and negative (blue) values. The position of the ssDNA molecule is represented by the green dot. Each red dashed line shows the position of an extreme value of each potential.

