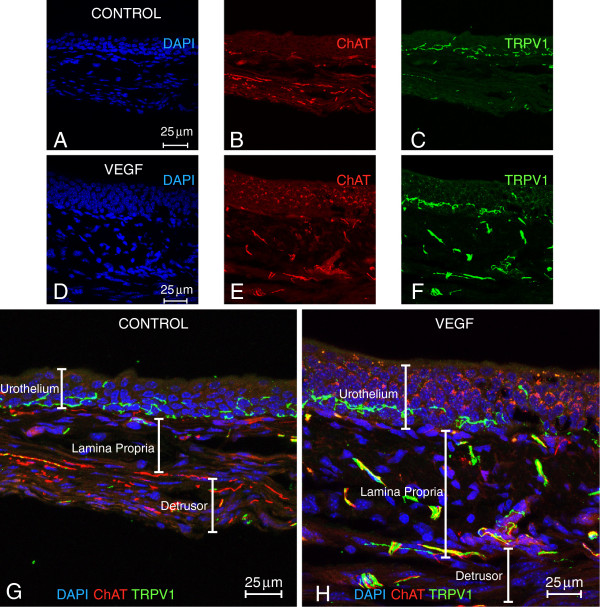
Figure 7.
Representative photomicrographs of ChAT mouse bladder cross-sections isolated from control and a single VEGF instillation (Table 1). Flattened images from 10 μm thick cross-sections from control and VEGF treated are presented side by side to permit comparison. DAPI staining highlighted the cell nuclei (A and D), ChAT was visualized by the fluorescent protein (td tomato; B and E), and sensory nerves were identified by TRPV1 immunoreactivity (C and F). Enlarged and merged microphotographs are presented to permit a better appreciation of the differences between control (G) and VEGF-treated bladders (H).

