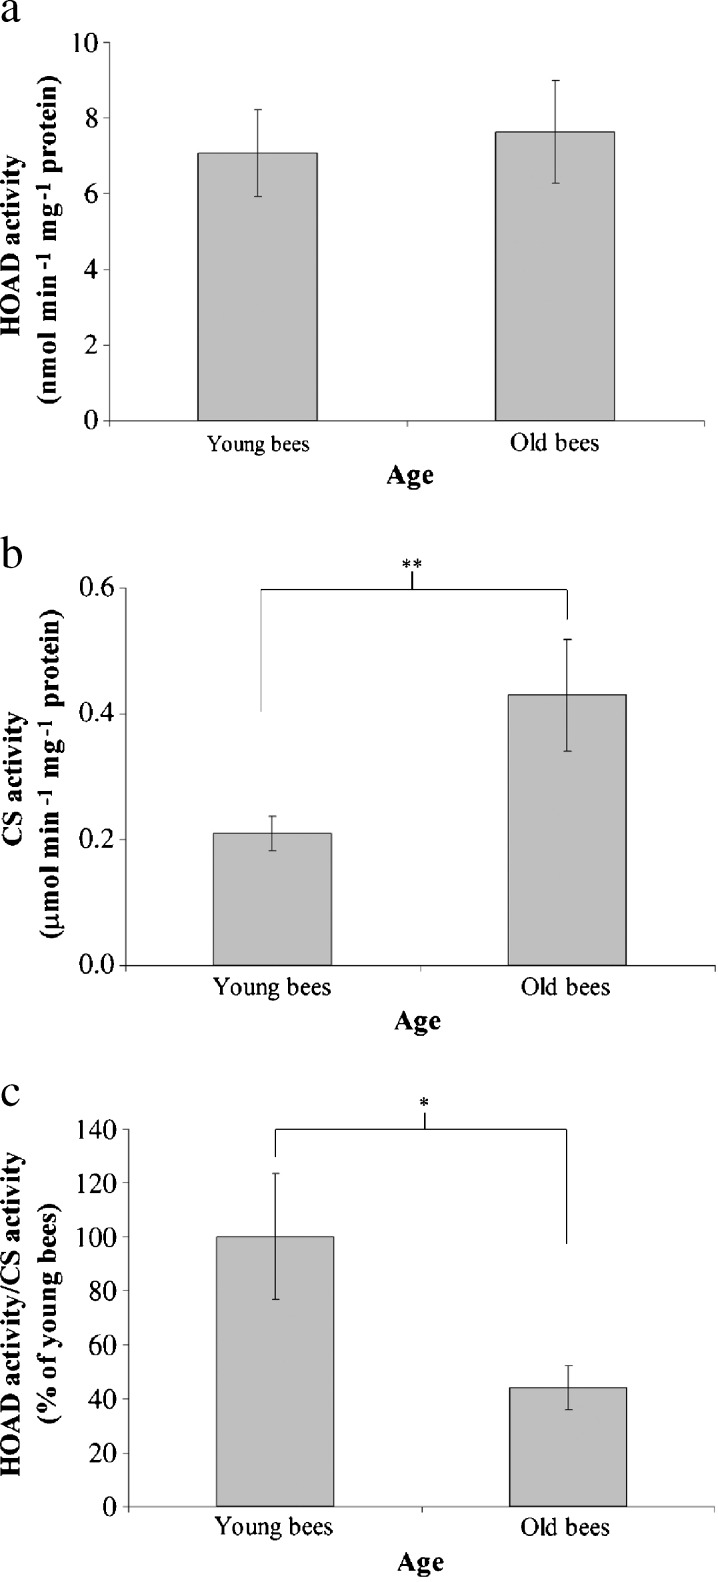
Fig. 5.
HOAD activity (a), CS activity (b), and the ratio of HOAD activity/CS activity (c) in the trophocytes and fat cells of young and old workers. The ratio of HOAD activity/CS activity (β-oxidation) was normalized to the expression in young workers; the results are shown as percentages and represent the mean ± SEM (n = 21). Asterisks indicate statistical significance as determined by two-sample t test (*P < 0.05; **P < 0.01)

