Fig. 5.
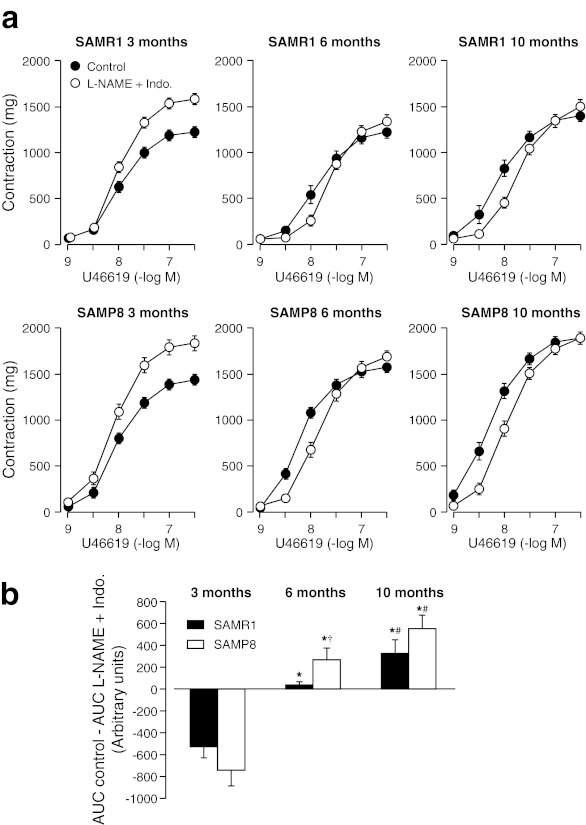
a Concentration–response curves to U46619 in aortic rings from 3-, 6-, and 10-month-old SAMR1 and SAMP8 mice in the absence (Control) and in the presence of l-NAME (10−4 M) plus indomethacin (Indo. 10−5 M). b Area under curves (AUC) from concentration–response curves in absence (control) minus AUC in the presence of l-NAME (10−4 M) plus Indo. (10−5 M). Each data point show mean ± SEM from n = 10 mice for each group. *P < 0.05 vs. 3-month-old group of the same strain and treated group, #P < 0.05 vs. 6-month-old group of the same strain, and †P < 0.05 vs. SAMR1 group with same age. Each data point show mean ± SEM from n = 10 mice for each group

