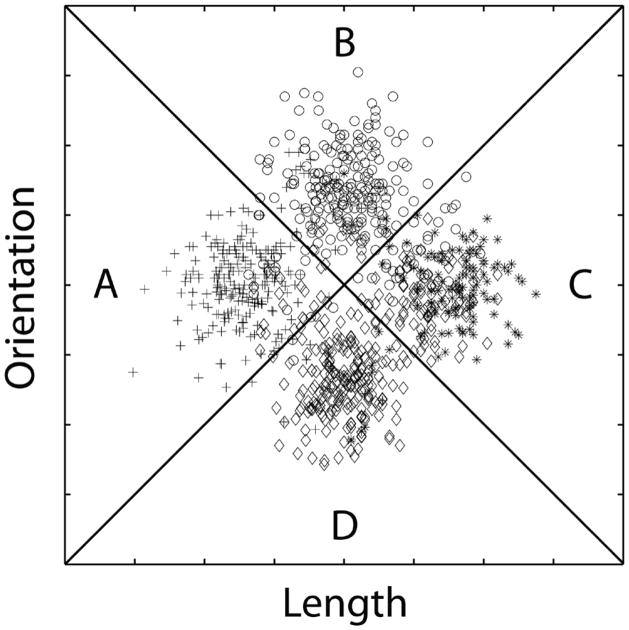
Figure 2.
An abstract representation of the stimuli used in Experiments 1, 2, and 3. All stimuli were single lines that varied across trials in length and orientation. Plus signs denote the length and orientation of exemplars in category A, circles denote exemplars in category B, stars denote exemplars in category C, and diamonds denote exemplars in category D. The diagonal lines denote the optimal decision bounds.

