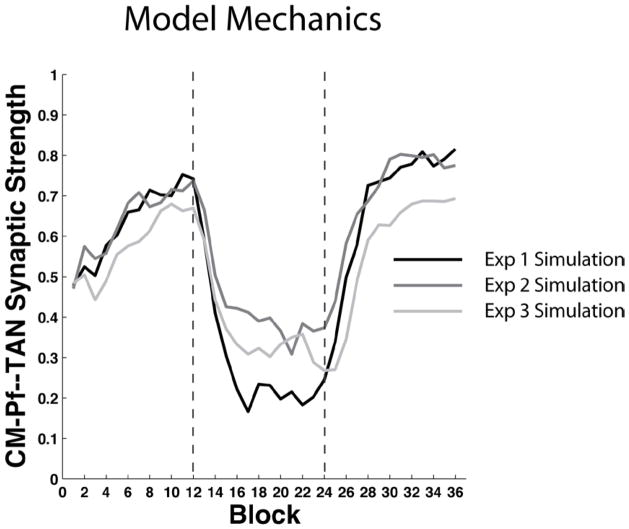
Figure 8.
Mean cortical-MSN and CM-Pf—TAN synaptic strengths in the model simulation of Experiments 1 – 3. Top Panel: Simulation of Experiment 1. Middle Panel: Simulation of Experiment 2. Bottom Panel: Simulation of Experiment 3. The vertical lines denote transitions between phases (i.e., acquisition, intervention, reacquisition).

