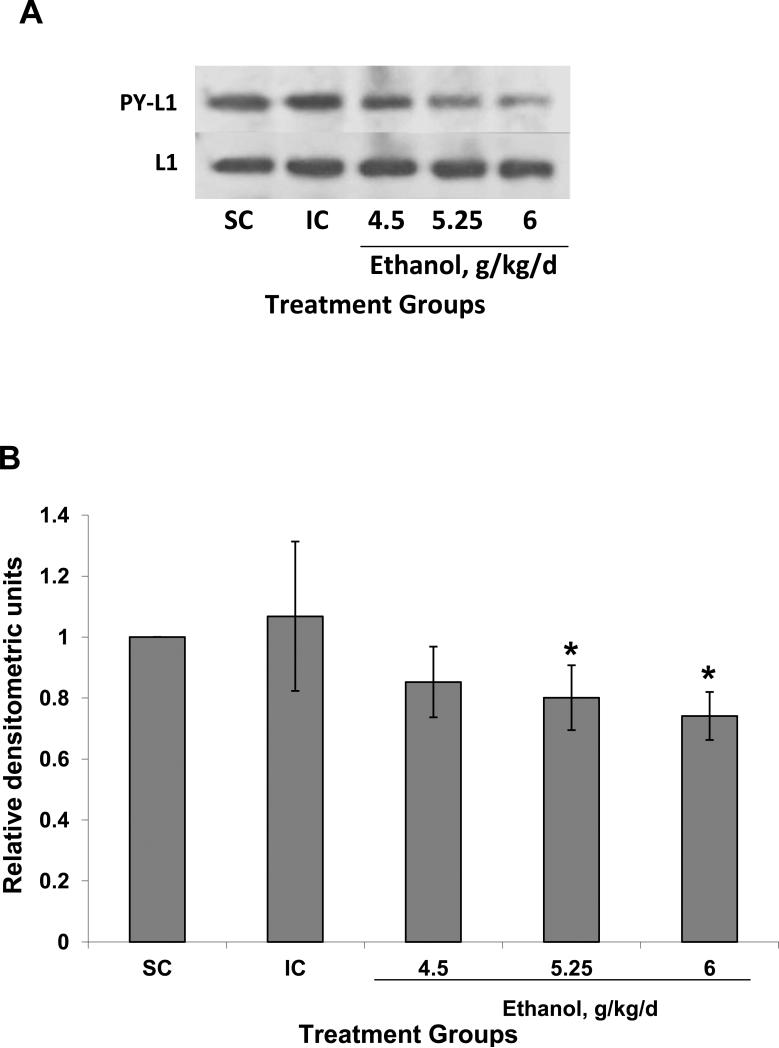
Figure 3.
Tyrosine phosphorylation of L1 is decreased by ethanol treatment in vivo. (A) Animals were treated and lysates prepared as described in Fig 2. Supernatants with equal amounts of protein were immunoprecipitated with antibodies to the cytoplasmic domain of L1, then immunoblotted for phosphotyrosine (PY-L1). Ethanol treatment decreased the amount of L1 which was phosphorylated on a tyrosine with the exception of Y1176 (Yeaney et al., 2009). Blots were stripped and reprobed for total L1 as a loading control (L1). (B) Densitometric quantification of tyrosine phosphorylation corrected for total L1 is plotted as relative densitometric units. The values of 3 different experiments are shown. The bar indicates the mean of the values +/- S.D. ANOVA single factor, p<0.07. Both 5.25 and 6.0 g/kg/d results in significantly reduce tyrosine phosphorylated L1 (*vs SC and IC, p<0.05, paired t-test). The 4.5 g/kg/d was nearing significance (vs SC, p<0.08; vs IC, p<0.06).

