Fig. 1.

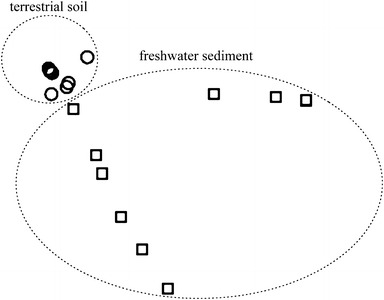
NMDS plots produced by T-RFLP analysis of ITS sequences from environmental RNA (cDNA) from the freshwater sediment (squares) and soil (circles)

NMDS plots produced by T-RFLP analysis of ITS sequences from environmental RNA (cDNA) from the freshwater sediment (squares) and soil (circles)