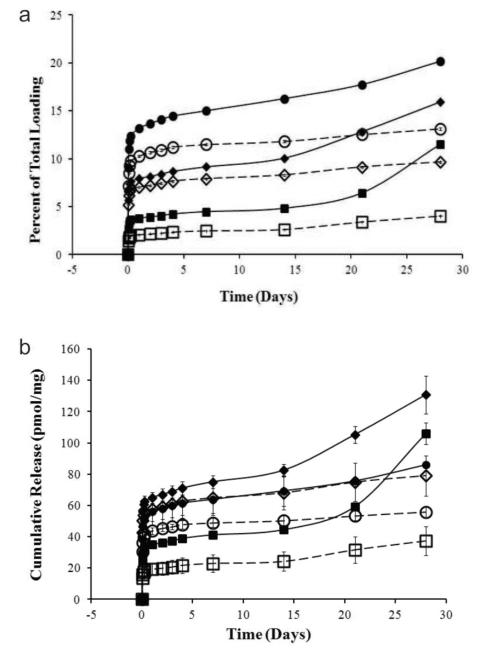
Figure 3.
Cumulative release of siRNA from NPs shown as a function of: (A) percent total loading and (B) total mass released with respect to incubation time. Particles were incubated in slightly acidic (pH 5, solid line) or neutral (pH 7, dashed line) conditions. Squares, diamonds, and circles indicate an N:P ratio of 3, 8, and 14, respectively. Error bars represent standard deviation from the mean, and are very small in (A).

