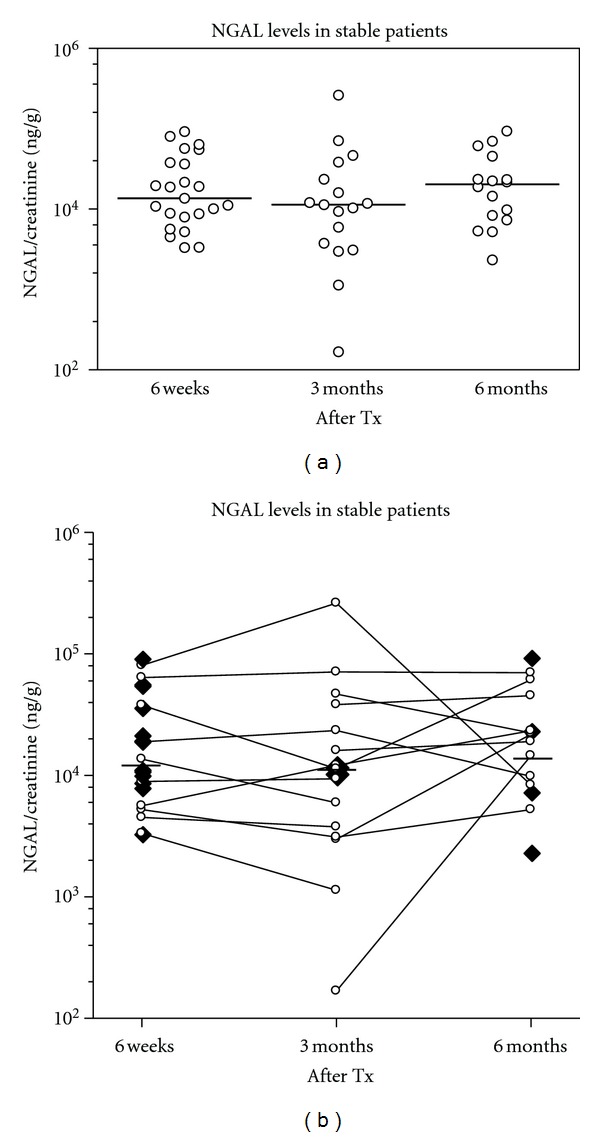
Figure 2.

(a) NGAL excretion in stable patients without ATI at 6 weeks, 3 months, and 6 months after transplantation. Shown is the urinary NGAL/creatinine ratio at 6 weeks (n = 23), 3 months (n = 17), and 6 months (n = 16) in patients after kidney transplantation. (b) Individual course of NGAL excretion of the stable patients at 6 weeks, 3 months, and 6 months after transplantation. Depicted are single measurements (n = 13 at 6 weeks, n = 2 at 3 months, n = 4 at 6 months) as single black squares and serial measurements (6 weeks to 3 months: n = 4 patients, 3 months to 6 months: n = 5 patients, and 6 weeks to 3 months and 6 months: n = 6 patients) as open circles connected by lines. Total measurements at 6 weeks: n = 23, at 3 months: n = 17, and 6 months: n = 16.
