Figure 5.
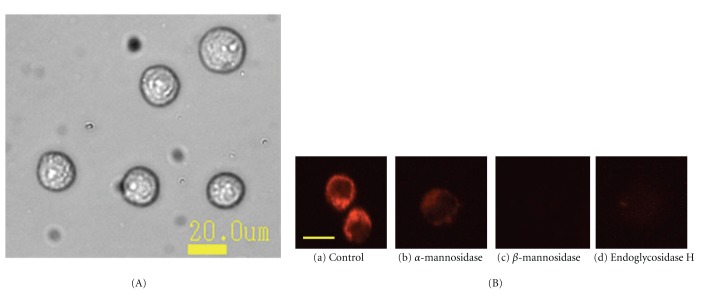
(A) Bright field image of OST cells. The diameter of the OST cells was 19.9 μm ± 1.5 μm. (B) Fluorescence microscopic observations of the binding of ESA to OST cells. The cells were pretreated for 2 hours with different glycosidases and then incubated with rhodamine 6G-labeled ESA. (a) Untreated cells (as control); (b) pretreated with α-mannosidase; (c) pretreated with β-mannosidase; and (d) pretreated with endoglycosidase H. After the pretreatment with the glycosidases, which led to a cleavage of some of the sugar chains on the surface of the OST cells, incubation of the pretreated cells with rhodamine 6G-labeled ESA occurred during 1 hour at 37°C in a humidified atmosphere of 5% CO2. Scale bar shows approximately 20 μm. This scale was calculated from the bright field image.

