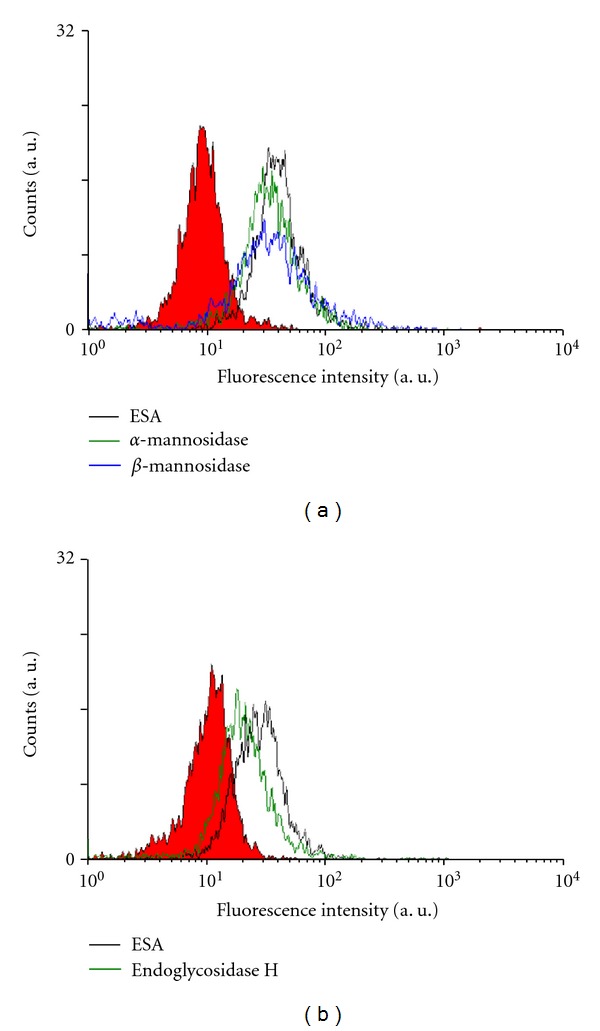
Figure 6.

Flow cytometric analysis of OST cells that were pretreated with a glycosidase as described in the legend of Figure 5 and then incubated with FITC-labeled ESA (balck line). Pretreatment was with either α-mannosidase (green line) or with β-mannosidase (blue line) (a), or with endoglycosidase H (green line) (b). The filled curves represent control measurements with untreated cells. PBS was added to OST cells as control (red fill).
