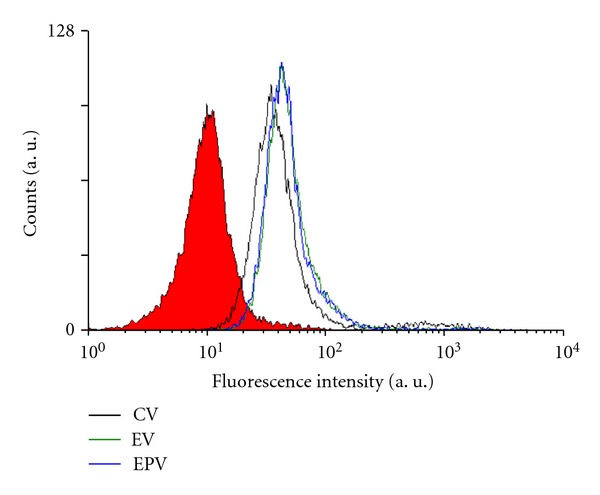
Figure 7.

Flow cytometric analysis of the interaction between OST cells and different types of Span 80 vesicles containing entrapped FITC: control vesicles (CV, black line), vesicles with immobilized ESA (EV, green line), and PEGylated vesicles with immobilized ESA (EPV, blue line). Before analysis, the OST cells were incubated with the vesicles during 15 min at 37°C in a humidified atmosphere of 5% CO2. PBS was added to OST cells as control (red fill).
