
Figure 6.
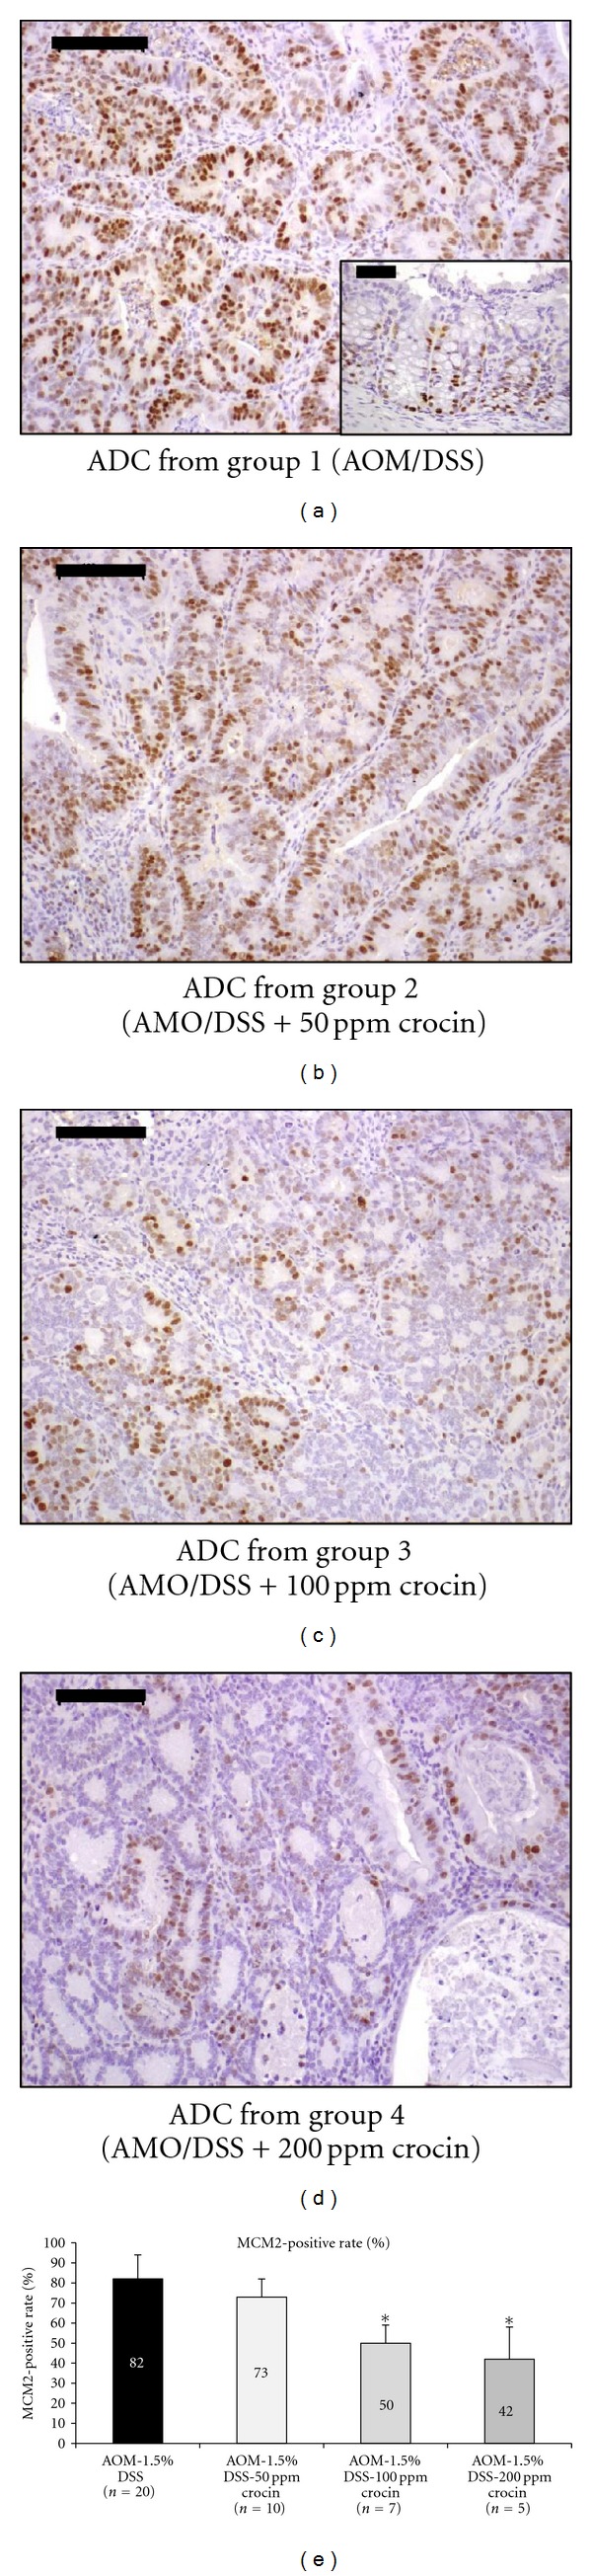
Immunohistochemical staining for MCM2 in an adenocarcinoma that developed in a mouse from (a) group 1 (AOM + 1.5% DSS), (b) group 2 (AOM + 1.5% DSS + 50 ppm crocin), (c) group 3 (AOM + 1.5% DSS + 100 ppm crocin), and group 4 (AOM + 1.5% DSS + 200 ppm crocin). The insert in (a) is normal colonic mucosa. Bars, 100 μm. The graph summarizes the data on the MCM2-positive rates of adenocarcinomas from groups 1 through 4 (n = 5 each). *P < 0.001 versus the AOM + 1.5% DSS group.