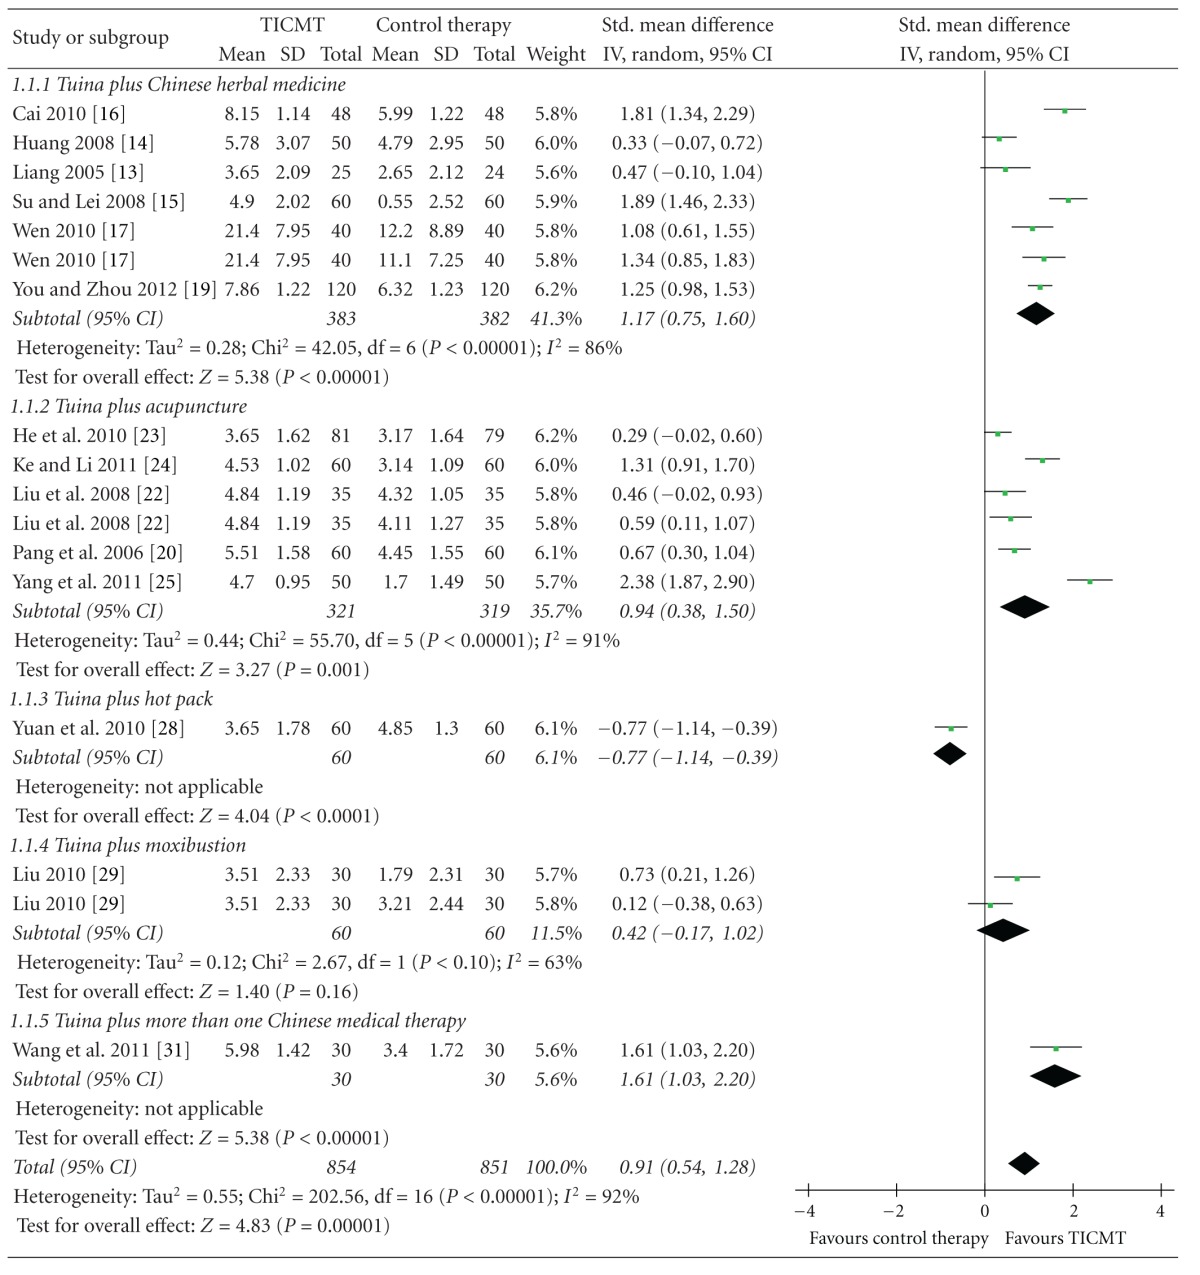
Table 3.
Forest plots of the effect of Tuina-focused integrative Chinese medical therapies (TICMT) on pain of in-patients with low back pain. Box in the line for each study: the mid-point of the box represents the mean effect estimate, which area shows the weight given to the study, and the line represents the confidence intervals of the mean effect estimate. The diamond below these studies represents the overall effect. The vertical line, which corresponds to the value 0 in the plot, is the line of no effect. Note that it says favours TICMT to the right of the vertical line and favours control therapy to the right of the vertical line.

|
