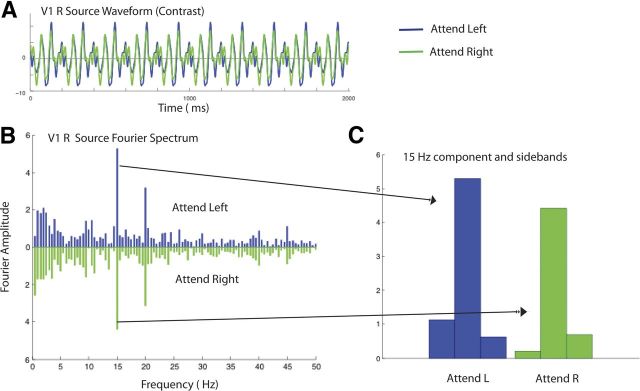
Figure 4.
Sample cortical source waveforms from one observer and the corresponding Fourier spectra in the contrast detection condition when the observer attended to the 15 Hz stimulus on the left or the 20 Hz stimulus on the right. A, Estimated cortical source waveform in V1 in the right hemisphere. The waveforms for attend-left and attend-right conditions are shown in blue and green, respectively. B, The corresponding Fourier spectra for the attend-left (blue) and attend-right conditions (green). Strong evoked responses can be seen at the two stimulus frequencies, 15 and 20 Hz. C, Comparison of the 15 Hz response in the attend-left and attend-right condition. The central bar in the triplet is the 15 Hz response, and the flanking bars show the amplitude of the responses at 15 ± 0.5 Hz.

