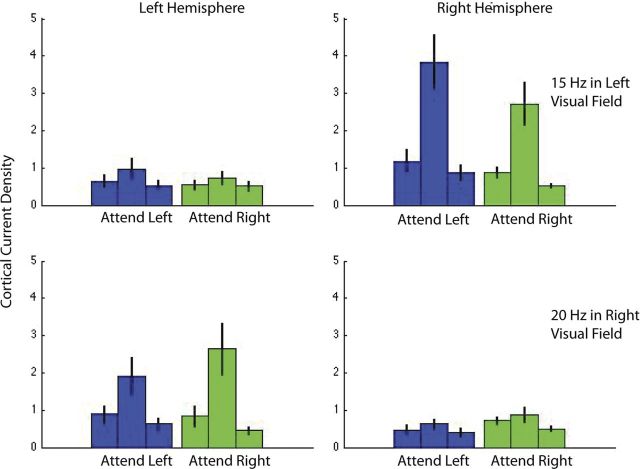
Figure 5.
Cortical current density in area V1 for the attend-contrast conditions with a vertical annulus, averaged across 13 observers. The upper and lower rows show frequency-tagged responses at 15 and 20 Hz, which are the first harmonics of the annuli on the left and right, respectively. Blue and green represent the attend-left and attend-right conditions. The central bar in the triplet shows response at the stimulus frequency while the flanking bars show responses at frequencies ± 0.5 Hz on either side of this frequency and serve as a measure of noise. The response is clearly contralateral and shows modulation due to attention. The data in each panel are similar to that in Figure 4C, except that they show data averaged across all observers with error bars indicating SE.

