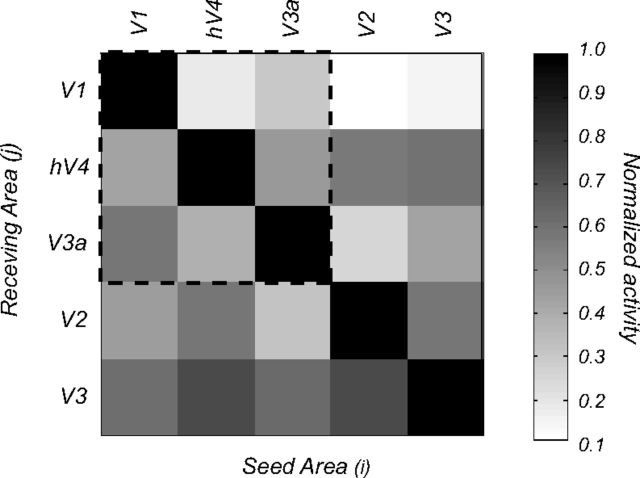
Figure 6.
Cross-talk matrix for the 13 observers in our study. The columns show activation in the receiving area (j) when a particular seed area (i) is activated. Activation in the seed areas (the diagonal terms) is much stronger than in other areas (off-diagonal terms), indicating that the cross talk is modest. The matrix within the dashed lines shows the cross talk for the three foveal clusters (V1, hV4, and V3A) reported in the study. The outer rows and columns show the cross talk for areas V2 and V3 that are part of the V1 cluster.

